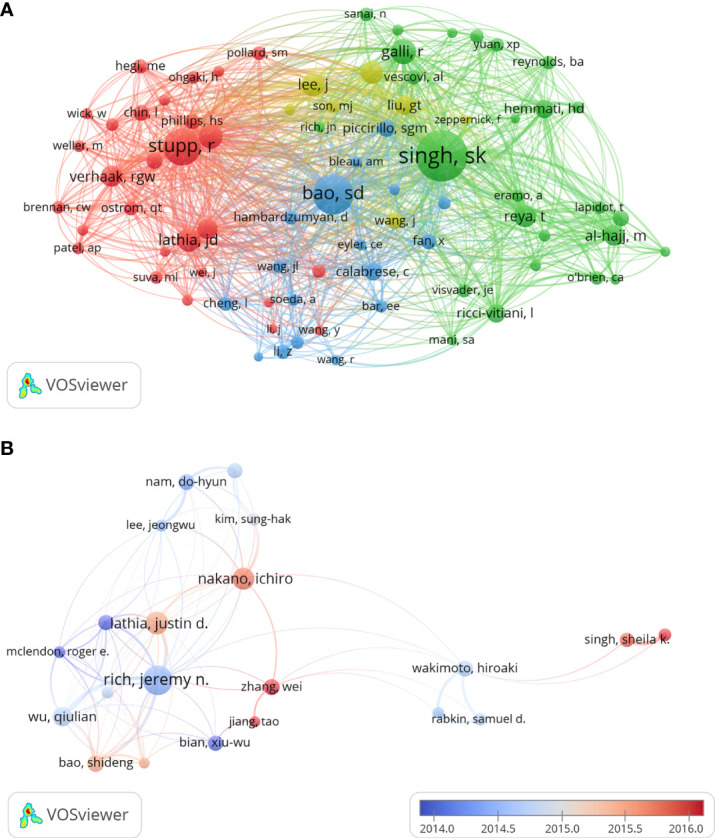
Figure 7.

The author co-citation network map (A) and co-authorship overlay map (B) generated by VOS viewer. Each node represents an author, and node size indicates the number of publications. The purple nodes represent the author appear earlier, whereas the red nodes reflect the recent occurrence.
