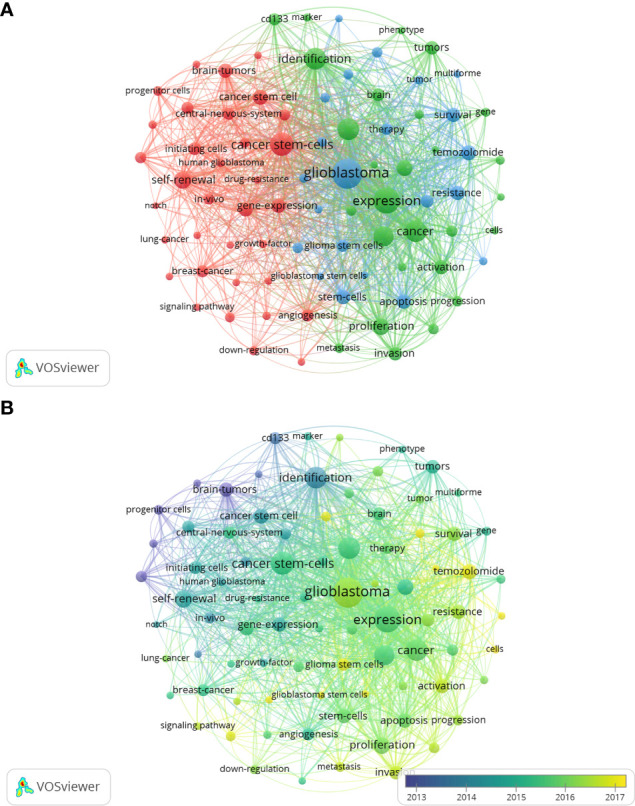
Figure 8.

The network visualization map (A) and overlay visualization map (B) of keywords co-occurrence analysis on glioma stem cells research. Keywords with similar categories are gathered in a cluster. There are three clusters, including glioma stem cell properties” (red nodes), “cell biological properties” (green nodes) and “oncology therapy” (blue nodes).
