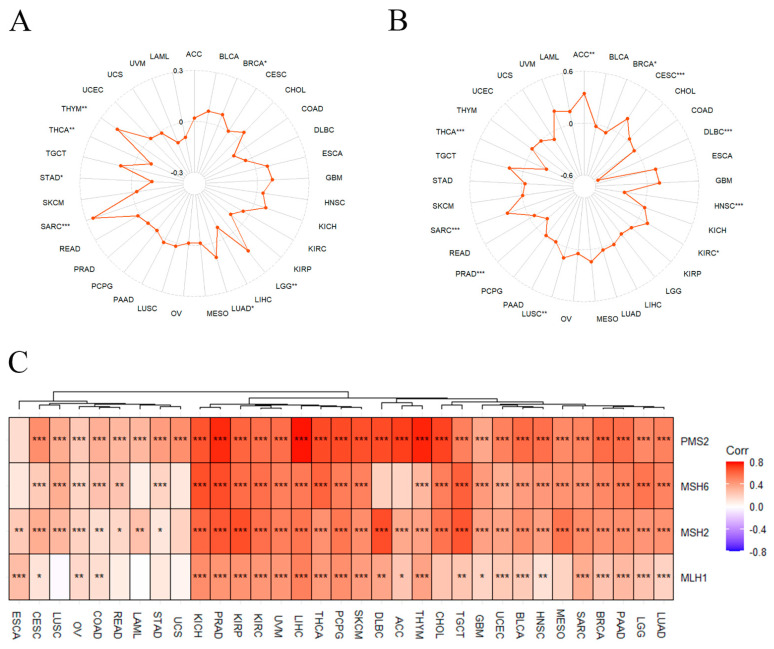
Figure 8.
GNL3L expression correlated with TMB, MSI, and MMR. (A) Radar plot of the correlation between GNL3L expression and TMB. (B) Radar plot of the correlation between GNL3L expression and MSI. (C) Heatmap of the correlation between GNL3L expression and MMR genes. * p < 0.05; ** p < 0.01 and *** p < 0.001.

