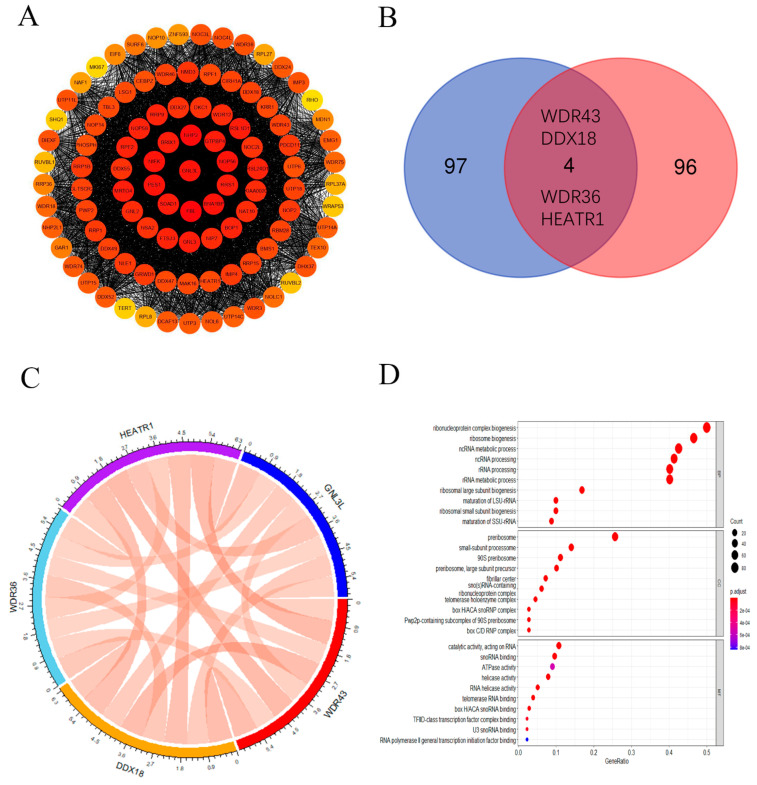
Figure 10.
GNL3L-related gene enrichment analysis. (A) Co-expression network of GNL3L genes displayed in Cytoscape software. (B) Venn diagram of the genome based on the STRING database and the GEPIA2 database. (C) GNL3L, WDR43, DDX18, WDR36, and HEATR1 gene expression correlation chord plots. (D) Plot of the results of the GO enrichment analysis of GNL3L and its related genes.

