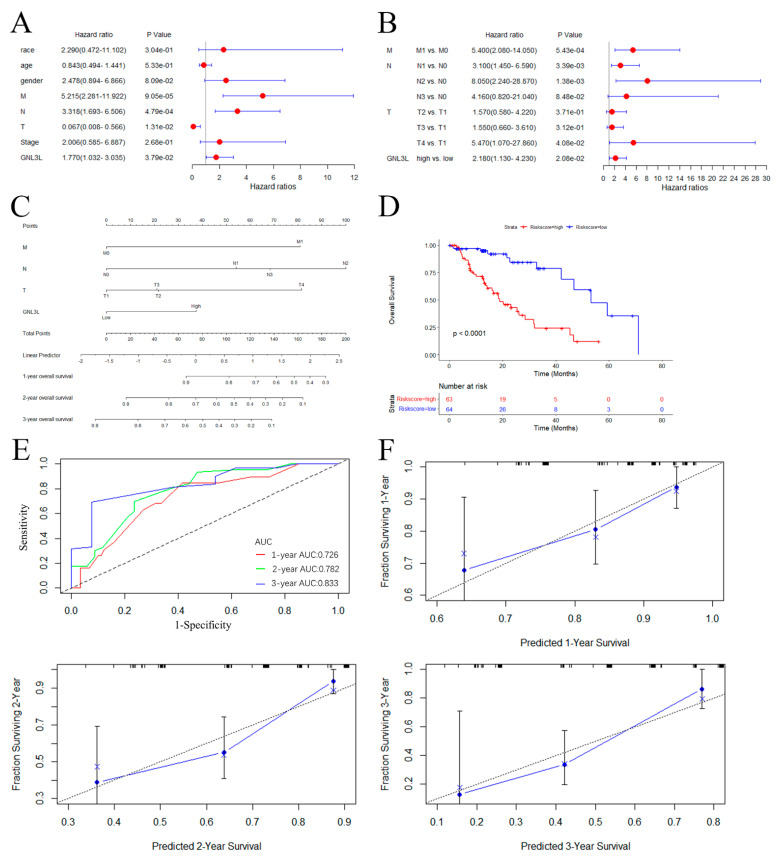
Figure 11.
ESCA prediction model building and evaluation. (A) Forest plot of univariate Cox regression results. (B) Forest plot of multi-factor Cox regression results. (C) The nomogram based on GNL3L and M, T, and N stages. (D) Kaplan–Meier curves plotted after stratifying high−risk and low−risk patients based on median risk scores derived from the nomogram. (E) Evaluation of the ROC curve of the nomogram. (F) Evaluation of the calibration curve for the nomogram.

