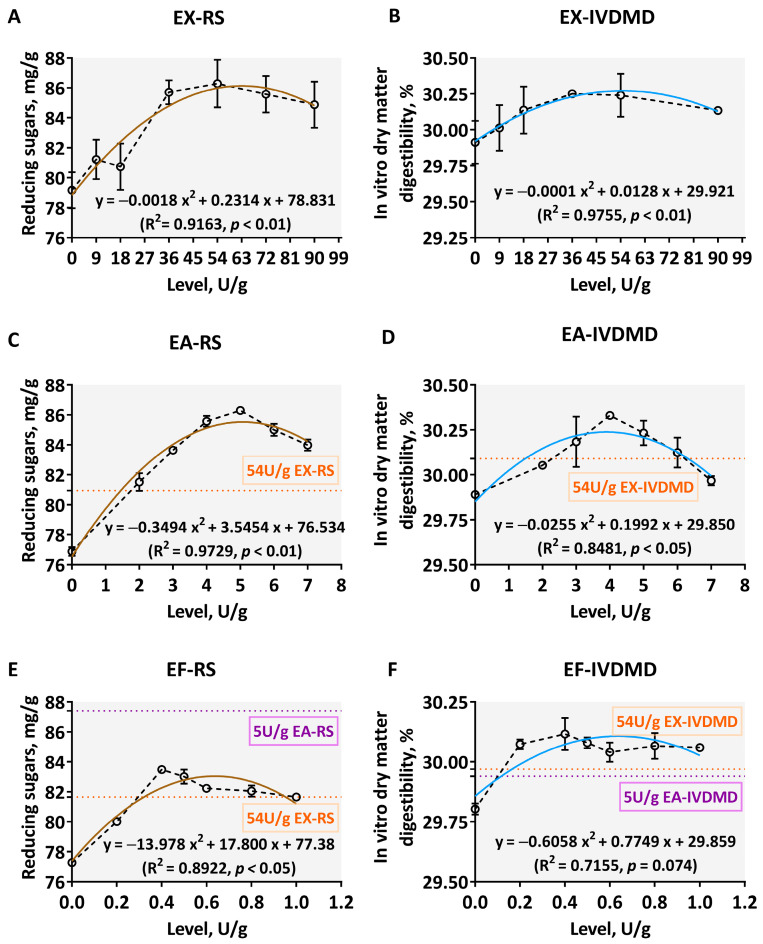
Figure 3.
Disassembly degrees of corn AX by different levels of xylan-degrading enzymes. The core EX (A,B) and two debranching enzymes ((C,D): EA; (E,F): EF were produced from Aspergillus niger. The dark brown curves in scatter plots (A,C,E) display the reducing sugars (RS) trend, while the light blue (B,D,F) represents the fit of in vitro dry matter digestibility (IVDMD). The orange and purple dotted lines show RS or IVDMD indicators corresponding to the hydrolysis of 54 U/g EX and 5.0 U/g EA for this composite substrate, respectively. The data are expressed as the means ± SD.

