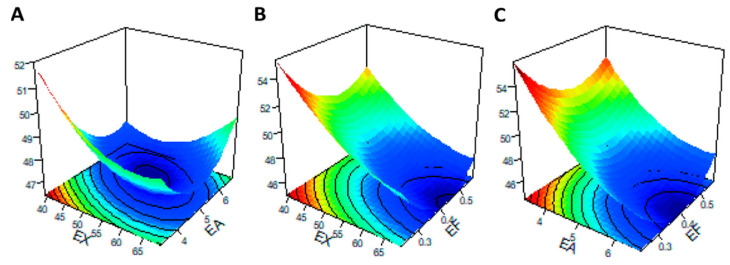
Figure 4.
Response surface and contour plots of the interaction effects between enzyme addition levels for factors [(A): EX/EA; (B) EX/EF; (C) EA/EF] on the in vitro dry matter digestibility (y2). The abscissa axis at the bottom of the figure represents the two enzyme factors, respectively, and the vertical axis upward represents the corresponding response index (y). The associated contour plots are composed of the densely arranged circles on the underside.

