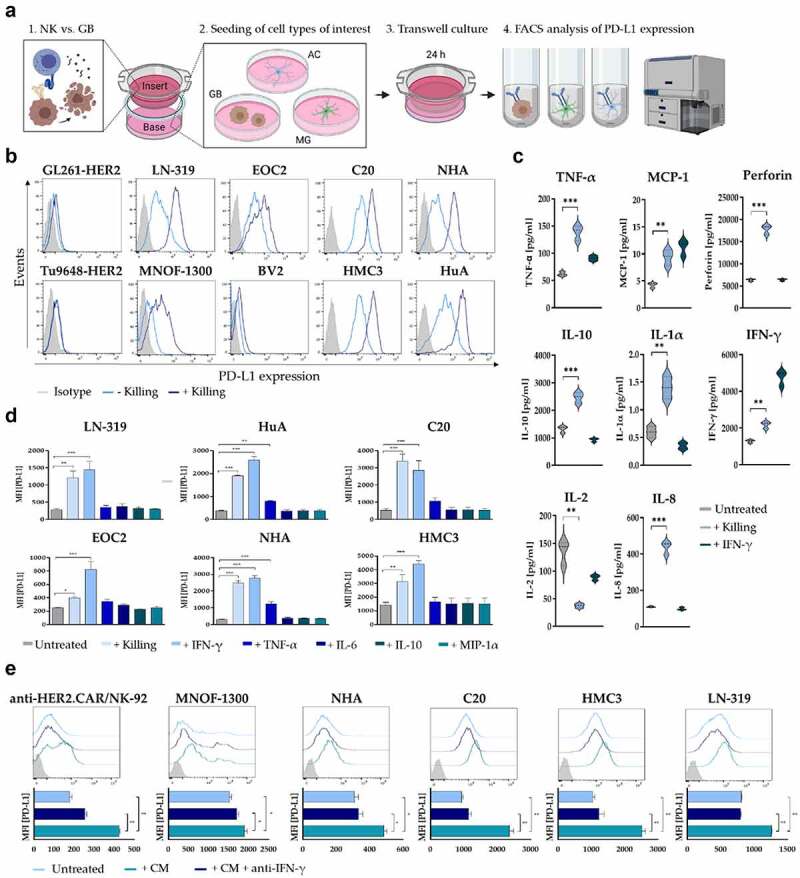
Figure 2.

PD-L1 regulation in response to anti-HER2.CAR/NK-92 cell-mediated tumor cell lysis. (a) Schematic representation of the PD-L1 transwell assay design. Soluble factors secreted from stimulated anti-HER2.CAR/NK-92 cells in the insert influence cells of interest in the base (GB: glioblastoma cells, AC: astrocytes, MG: microglia). (b) PD-L1 regulation in response to a transwell cytotoxicity assay was analysed on murine (GL261, Tu9648) and human (LN-319, MNOF-1300) glioma cell lines as well as on murine (EOC2, BV2) or human (C20, HMC3) microglia and human astrocyte (NHA, HuA) cell lines via flow cytometry. Cells of interest were seeded in wells (base) of a 24-well plate, while a cytotoxicity assay was performed in the insert (E/T ratio 1:1, murine cells of interest: anti-HER2.CAR/NK-92 vs. GL261-HER2, human cells of interest: anti-HER2.CAR/NK-92 vs. LN-319). After 24 h, PD-L1 expression of cells in the base was determined via flow cytometry. (c) Analysis of cytokine release by stimulated anti-HER2.CAR/NK-92 cells. Concentrations of IFN-γ, TNF-α, MCP-1, IL-1α, IL-2, IL-8, IL-10 and perforin were measured in cell culture supernatants using a Luminex multiplex bead assay. hIFN-γ [100ng/ml] served as positive control for cell stimulation. Mean values ± SD are shown; n=3. **p < 0.01, ***p < 0.001. (d) PD-L1 regulation in various cell types in response to stimulation with species-compatible (human/murine) recombinant cytokines was analysed via flow cytometry. Cells were incubated with recombinant cytokines for 24 h at a oncentration of 100 ng/ml. Mean values ± SD are shown; n=3, *p < 0.05, **p < 0.01, ***p < 0.001. (e) PD-L1 expression was assessed via flow cytometry upon cultivation in conditioned medium from a cytotoxicity assay (E/T ratio 1:1, anti-HER2.CAR/NK-92 vs. LN-319) either in the absence or presence of anti-human IFN-γ antibody for 24 h. Mean values ± SD are shown; n=3. *p < 0.05, **p < 0.01.
