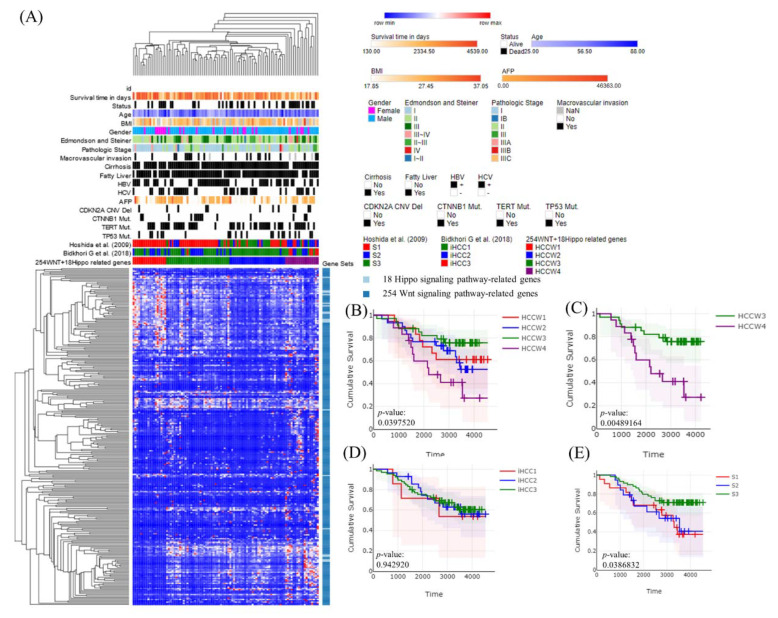
Figure 3.
Molecular classification of Taiwanese HCC patients using a panel of 272 Wnt–Hippo pathway genes. (A) Heatmap showing normalized expression levels of the 272 signature genes (rows) across subjects (columns) divided into four molecular subclasses (HCCW1–4), where blue and red indicate low and high expression, respectively. Significant differences in demographic characteristics, clinical annotations, molecular subclasses, and hepatitis B and C virus infection status across subjects are shown at the top of the figure. (B) Overall survival for subjects in each molecular subclass. (C) HCCW3 showed significantly better prognosis than HCCW4 based on two-sided log-rank tests. (D) The Bidkhori classification results were not significantly correlated with survival, whereas (E) the Hoshida classification results did show a significant correlation.

