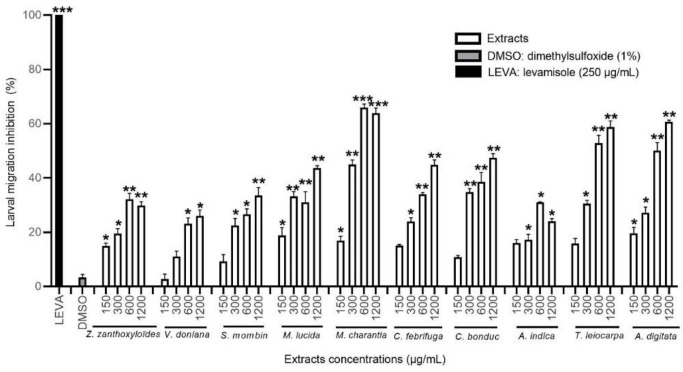
Figure 5.
Migration inhibition rate (in %) of H. contortus larvae treated with methanol extracts at different concentrations, DMSO, and levamisole. Asterisks indicate a significant difference compared to the negative control (DMSO) (* p < 0.05, ** p < 0.01, *** p < 0.001). Each histogram represents the mean ± standard deviation from 3 × 3 values.

