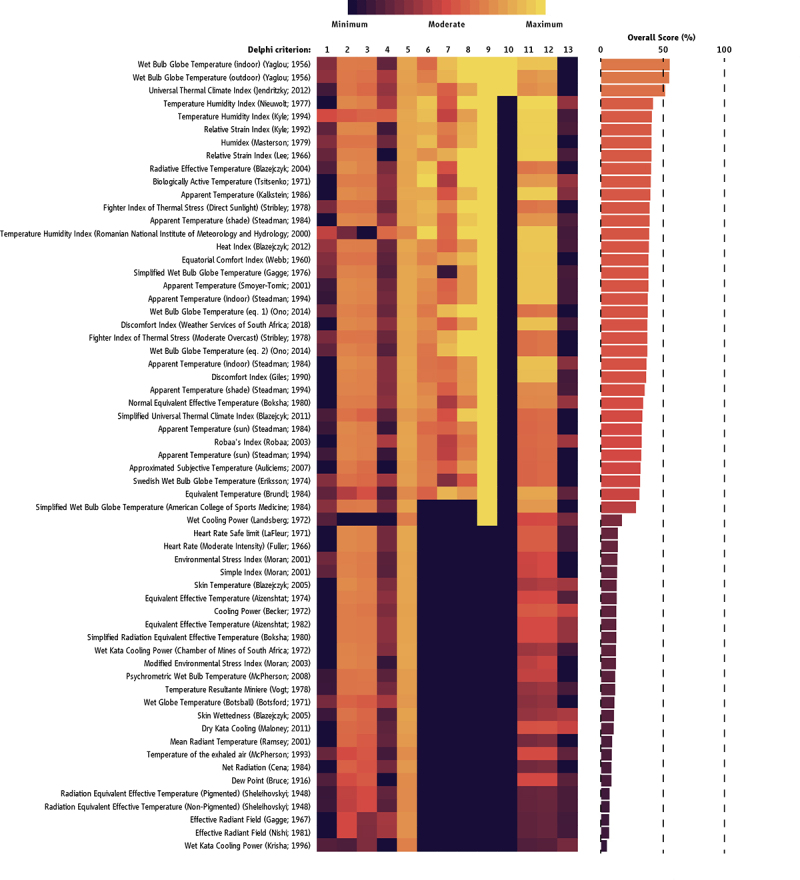
Figure 2.

Overall score of the 61 TSIs. Black (minimum) and yellow (maximum) colors indicate the score of each TSI across the different Delphi criteria listed in Table 2. Detailed scores and full references are provided in Table S2 in the supplementary material.
