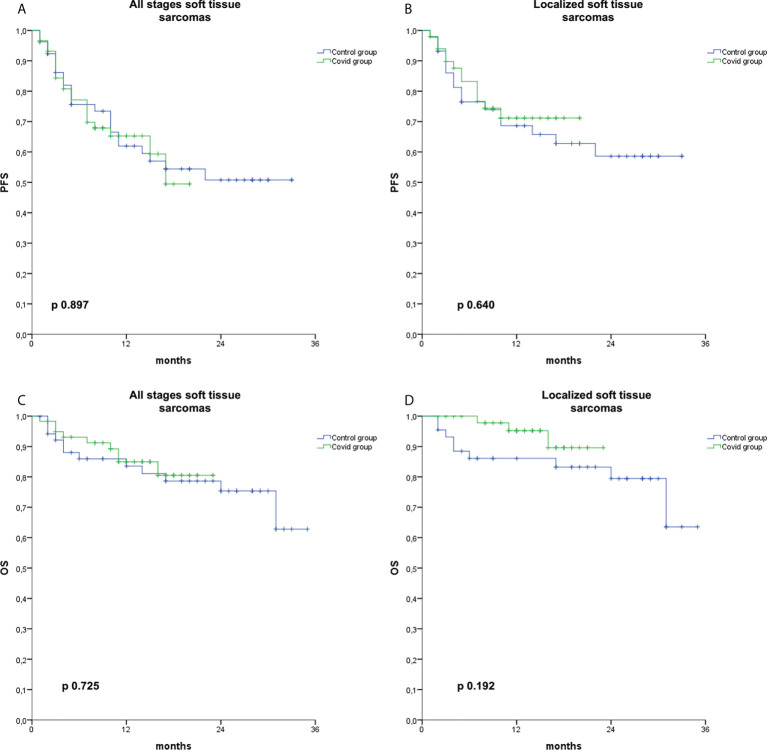
Figure 3.
Kaplan–Meier curves for PFS and OS in soft tissue sarcomas. Kaplan–Meier curve for PFS in soft tissue sarcomas irrespective of the stage at diagnosis (A), for PFS in localized soft tissue sarcomas (B), for OS in soft tissue sarcomas irrespective of the stage at diagnosis (C), and for OS in localized soft tissue sarcomas (D) in the Covid group (green) and the Control group (blue).

