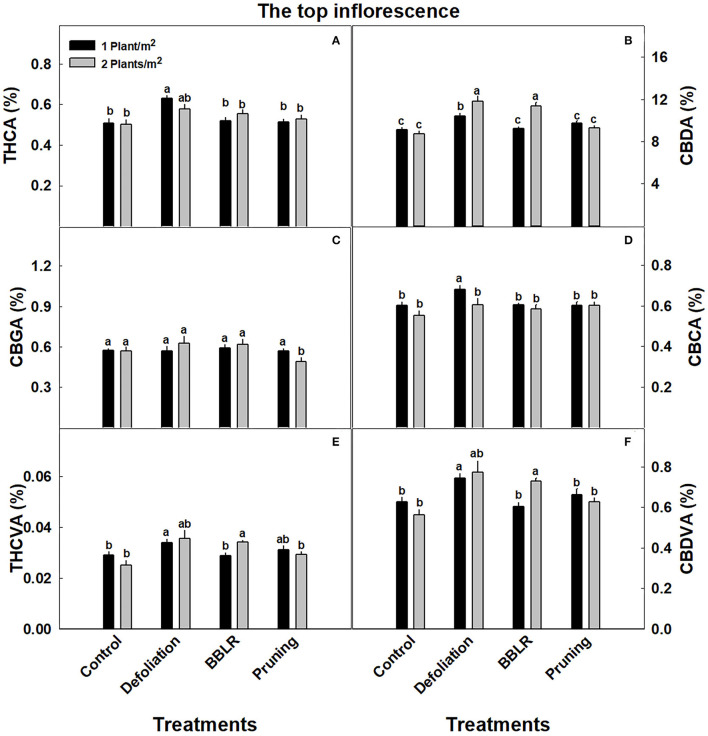
Figure 3.
Cannabinoid concentrations at the top inflorescence of cannabis plants grown under two densities and four architectural modulation treatments. The results are means and SE (n = 6). THCA (A), CBDA (B), CBGA (C), CBCA (D), THCVA (E), and CBDVA (F). Different letters above the bars represent significant differences between treatments by Tukey HSD test at α = 0.05. “BBLB” removal of leaves and branches from the bottom part of the plant.

