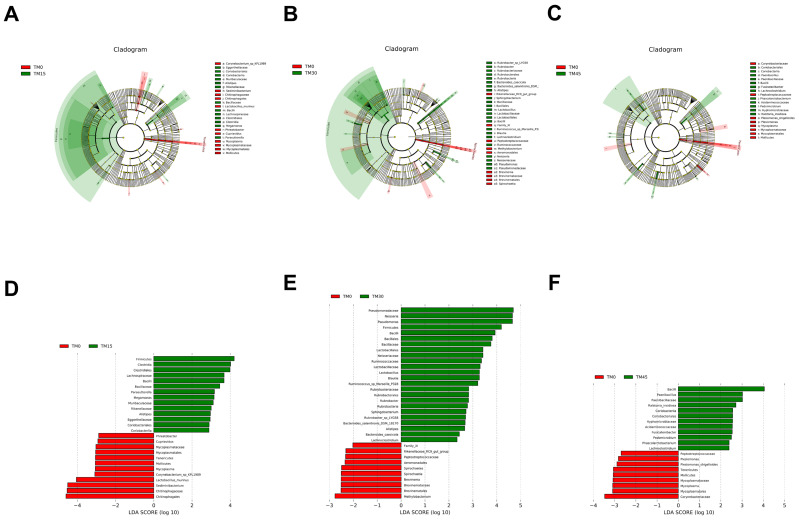
Figure 6.
LEFSE (Linear discriminant analysis Effect Size) analysis identified bacterial species that differed significantly in abundance among groups. (A−C) Differences in bacterial species abundance were represented by the color (Red indicates a taxon with significantly higher relative abundance in the TM0 group, and green indicates a taxon unit with significantly higher abundance in the TM addition groups). (D−F) Linear regression analysis (LDA) was used to estimate the magnitude of the effect of the abundance of each bacterial species on the differential effect.

