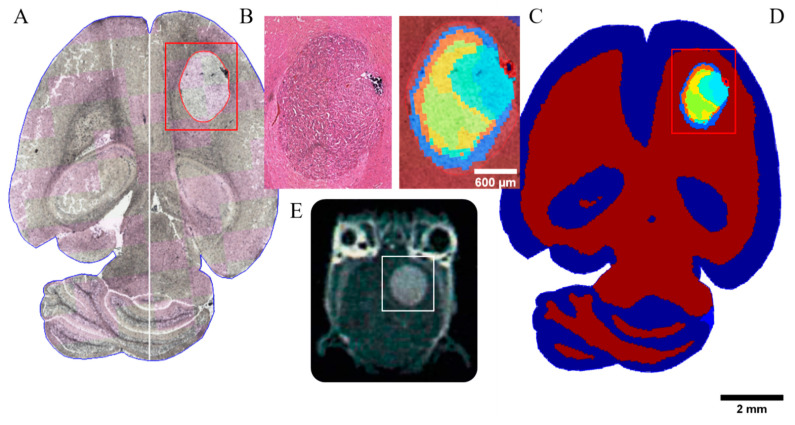
Figure 1.
Multimodal analysis of the CTV in a representative untreated brain tumor section of a U87MG mCherry sample. (A) MALDI mass spectrometry image as technique for proteomics analysis measured without staining. GTV is contoured in red within the evaluated region (red box). (B) H&E staining of tumor region. (C) The edges of the tumor are clearly shown by the segmentation of the protein/peptide detection and analysis determined by means of mass spectra. The resulting mass spectrometry data are consistent with the histologic annotation of the tumor. The clustering of the spectra shows a ring-shaped separation. (D) Unsupervised clustering map of mass spectra. (E) Corresponding T1-weighted MR image highlighting the tumor area (white box).

