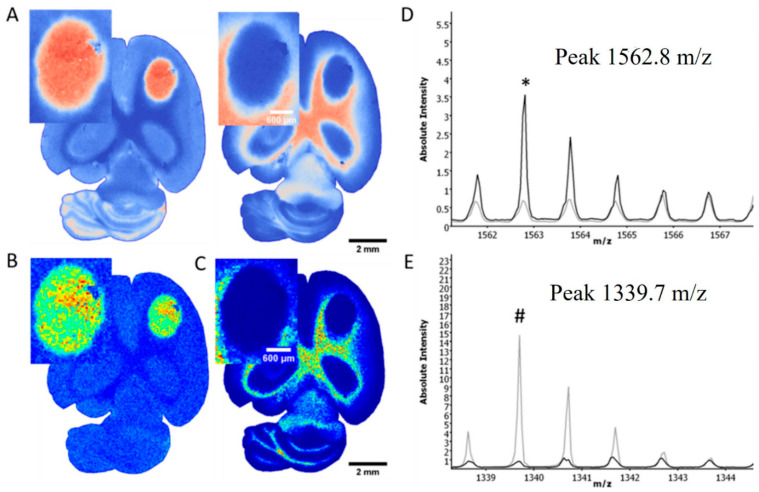
Figure 2.
Distinguished mass information in one exemplary sample of untreated U87MG-mCherry tumor and normal brain tissue. Principle component analysis of mass spectra demonstrates clusters of similarities and distinctions based on their measurement characteristics, showing a clear separation of tumor and brain tissue (A). Tissue-dependent mass spectra show differences in mass distribution of both tumor (B) and normal tissues (C), e.g., mass 1562.8 m/z as tumor peak ((D); asterisk *), or mass 1339.7 m/z as marker for normal tissue ((E); octothorpe #). The black line (D,E) represents mass spectra of the whole tumor area, whereas the grey line represents mass spectra of the normal brain tissue in the same content area.

