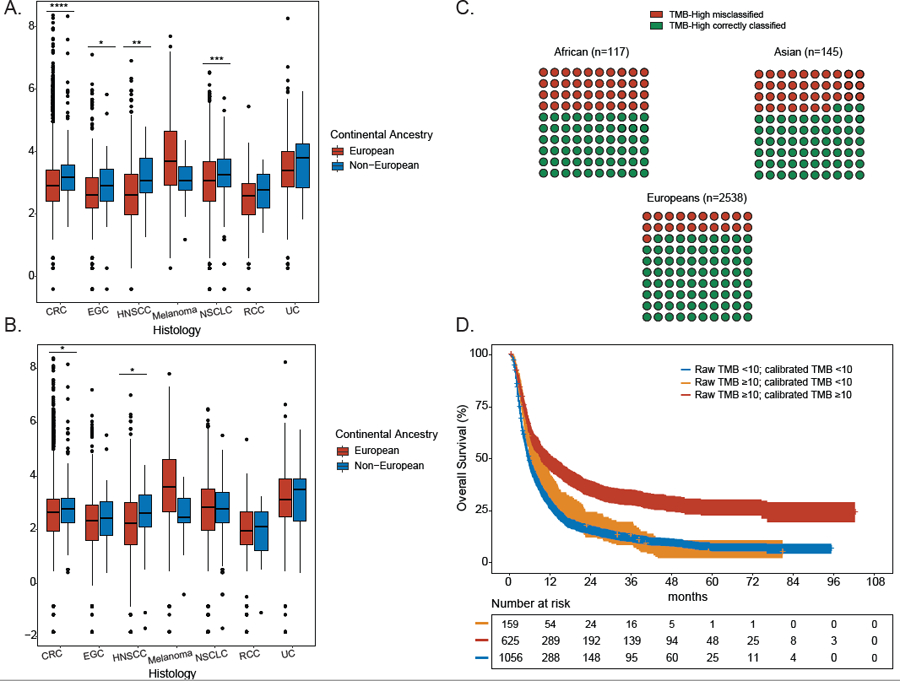
Figure 2: See also Figure S5 and Tables S3-S4. Differential TMB estimates across continental ancestral populations in the DFCI cohorts prior and after calibration and effects of TMB calibration on clinical outcomes.

A. Distribution of uncalibrated TMB estimates for each of 7 cancer types shown by genetic ancestry. A two-sided binomial test was used to establish P values (* <0.05, ** <0.01, *** <0.001, **** <0.0001). Data are represented as boxplots. The horizontal lines reflect the median, the lower and upper whiskers indicate 1.5 x the interquartile ranges. Circles are outliers. B. Distribution of calibrated TMB estimates for each of 7 cancer types shown by genetic ancestry. A two-sided binomial test was used to establish P values (* <0.05, ** <0.01, *** <0.001, **** <0.0001). Data are represented as boxplots. The horizontal lines reflect the median, the lower and upper whiskers indicate 1.5 x the interquartile ranges. Circles are outliers. C. 10x10 dot plot showing TMB misclassification rates for TMB-high tumors in each ancestral population in the entire DFCI cohort (n=2800 TMB-high patients). D. Impact of TMB calibration on overall survival in ICI-treated patients at DFCI (n=1840 patients). Patients were stratified into: (a) true TMB-low (raw TMB<10; calibrated TMB<10), true TMB-high (raw TMB≥10; calibrated TMB ≥10), and false TMB-high (raw TMB ≥10, calibrated TMB<10). CRC: colorectal cancer, EGC: esophagogastric cancer (EGC), HNSCC: head and neck squamous cell carcinoma, melanoma, NSCLC: non-small cell lung cancer, UC: urothelial carcinoma, RCC: renal cell carcinoma. See also Figure S5 and Tables S3-S4.
