
Figure 4: See also Table S5. Adjusted hazard ratios (HR) of clinical outcomes of different ancestral populations treated with ICI therapy in different cancer types.
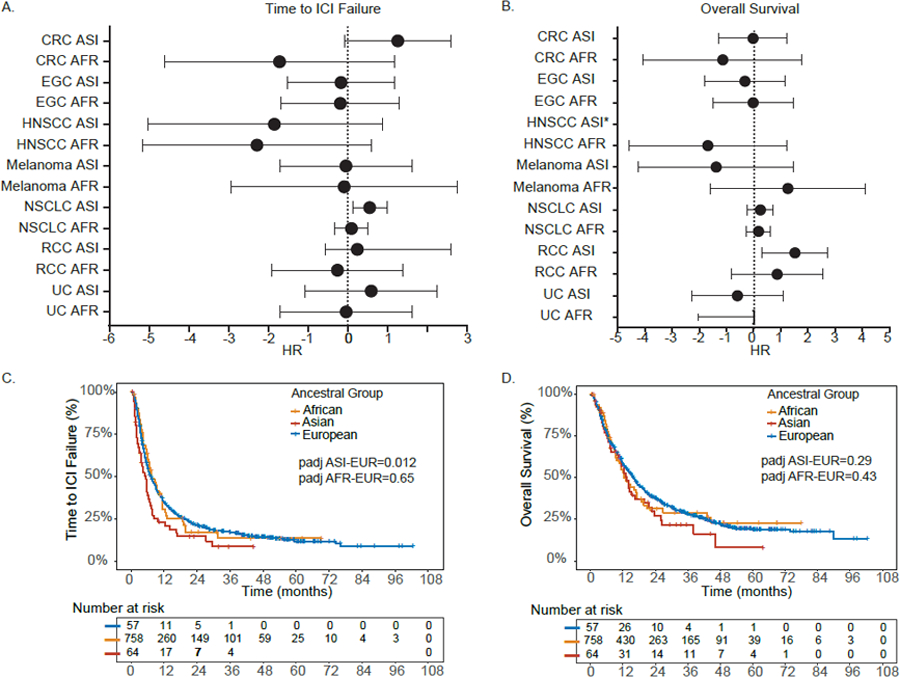
A. Adjusted HR ratios for time to ICI failure in the DFCI ICI cohort (n=1840). Data are presented as adjusted HR with 95% CI (reference group EUR). B. Adjusted HR ratios for overall survival. All p-values and hazard ratios in A and B are of the Wald x2 test from the Cox regression analysis, adjusted as detailed in the STAR Methods section. Data are presented as adjusted HR with 95% CI (reference group EUR). * A horizontal line is not shown for HNSCC given only 1 patient had an event and confidence interval ranged from 0 to infinity. C. Time to ICI failure and genetic ancestry in DFCI patients with NSCLC treated with ICI. D. Overall survival and genetic ancestry in DFCI patients with NSCLC treated with ICI. See also Table S5.