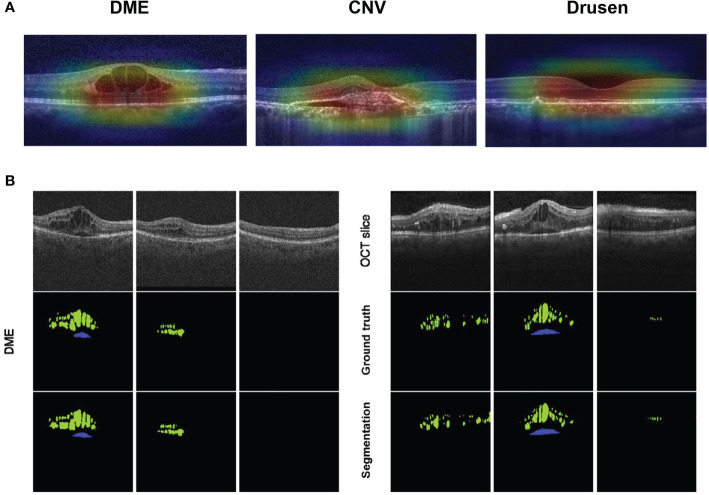
Figure 3.
Visualization features generated automatically from optical coherence tomography (OCT). (A) Feature areas of pathology in diabetic macular edema (DME), choroidal neovascularization, and drusen are highlighted, superimposed on the input image to show the areas that the AI model considered as vital in a diagnosis. (B) Segmentation findings of DME on OCT scans acquired with Cirrus (left) or Spectralis (right) devices: the upper row shows OCT raw slices; the middle row shows manual labels by certified graders considered as ground truth; the lower row shows automated results segmented by AI. (IRF, intraretinal cystoid fluid in green; SRF, subretinal fluid in blue) [Adapted from Schlegl et al., 2018 (68)].

