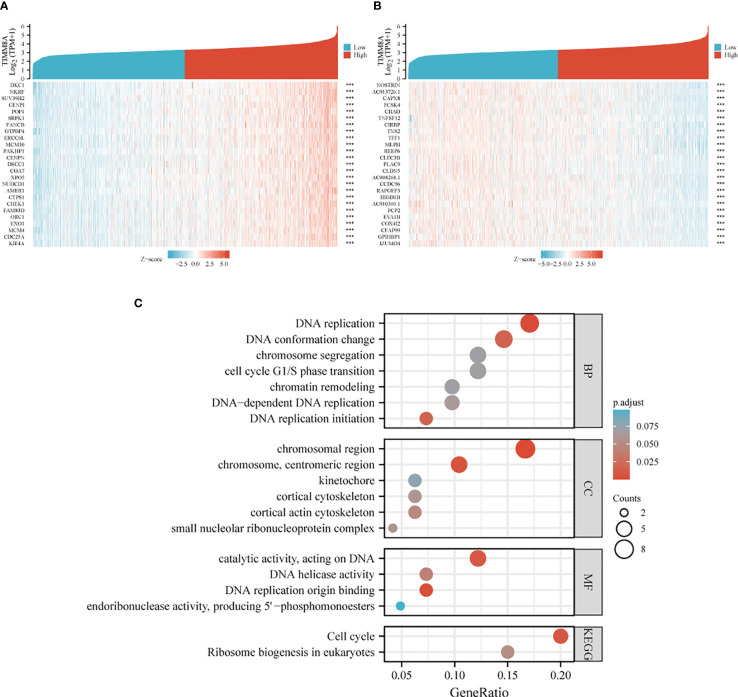
Figure 7.
Heat map and enrichment of TIMM8A-related differentially expressed genes in breast cancer. (A) heat map shows genes positively correlated to TIMM8A (showing the first 25 genes). (B) heat map shows genes negatively correlated with TIMM8A (showing the first 25 genes). (C) GO analysis and KEGG enrichment of differentially related genes. (***p > 0.001).

