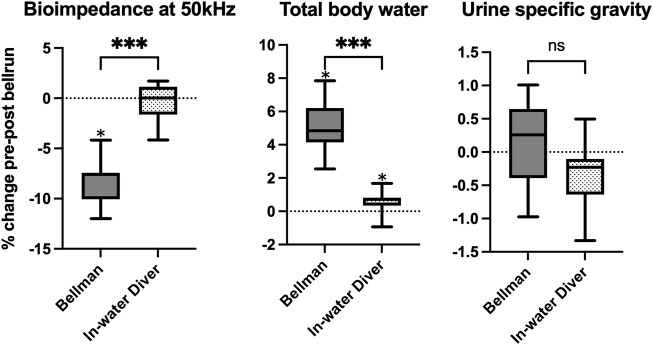
FIGURE 3.
Boxplot showing the % change in hydration markers during bell runs, for bellmen and in-water divers. Box edges represent 25th and 75th percentiles. Whiskers are minimum and maximum values. Calculation of differences were done using a paired t-test for urine specific gravity and Wilcoxon matched pairs test for bioimpedance and total body water. *median different from zero (p ≤ 0,05). *** significant difference between bellmen and in-water divers (p ≤ 0,001). “ns” no significant difference between bellmen and in-water divers.

