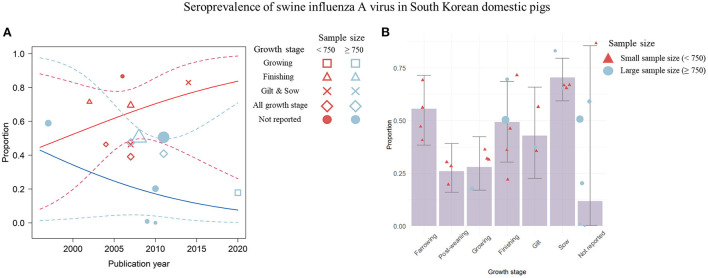
Figure 6.
Visualization of the seroprevalence data determined by the significant covariates; the publication year, the sample size, and the growth stage of pigs. (A) Change in swine influenza A virus (swIAV) seroprevalence according to the publication year shown by a weighted scatter plot. Solid red line denotes the regression model involved with the seroprevalence proportion, the small sample size, and the publication year. Solid blue line indicates regression describing the association among the proportion, the large sample size, and the publication year. The dashed lines indicate 95% CIs of the regression model. (B) swIAV seroprevalence by each growth stage using the bar plot. Circles or triangles indicate individual studies and the size of the figures corresponds to the weighted average of effect size of each study. The sample size is represented by red (small) and blue (large) colors. Error bar represents 95% CIs.

