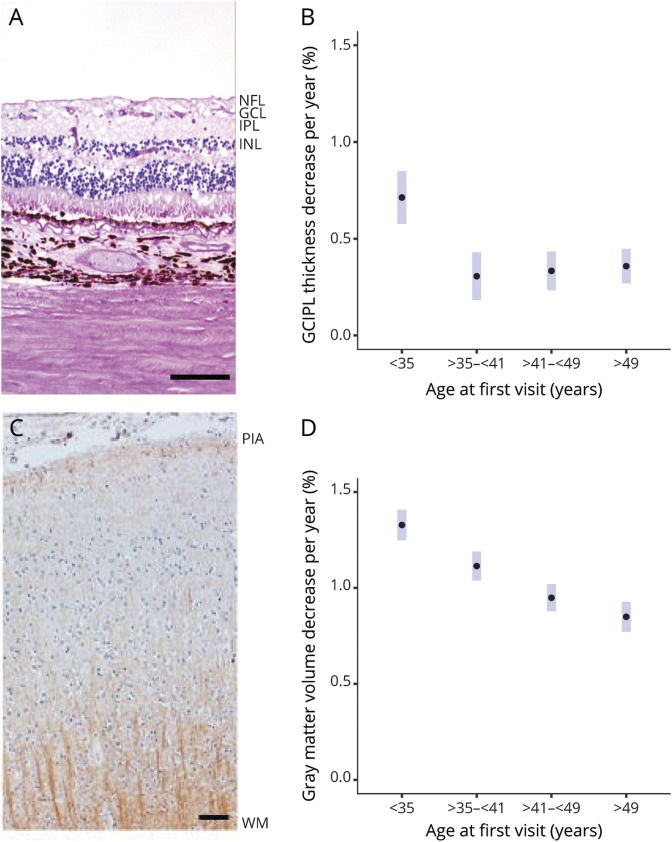
Figure 2. Rate of Neuronal Volume Loss Declines With Age in MS but Appears to Decline More Rapidly Earlier and Stabilizes in the Retina.
(A, C) Neuropathologic images of retina and brain cortex. (B, D) The association between the rate of atrophy and age at baseline. Scale bars of 200 μm (retina) and 50 μm (brain cortex). The GCIPL is given by retinal ganglion cells nuclei and their synapsis with bipolar cells (GCL + IPL) (A) while the brain cortex is formed by different kinds of neurons, oligodendrocytes, astrocytes, and microglia (C). (B, D) The association between the rate of atrophy and age at baseline. Estimated simple slopes (and 95% CI) for change per year across different age groups in mixed-effects model of GCIPL or cortical gray matter volume with interaction of age and time. GCIPL = ganglion cell-inner plexiform layer; GCL = ganglion cell layer; INL = inner nuclear layer; IPL = inner plexiform layer; NFL = nerve fiber layer; WM = white matter.

