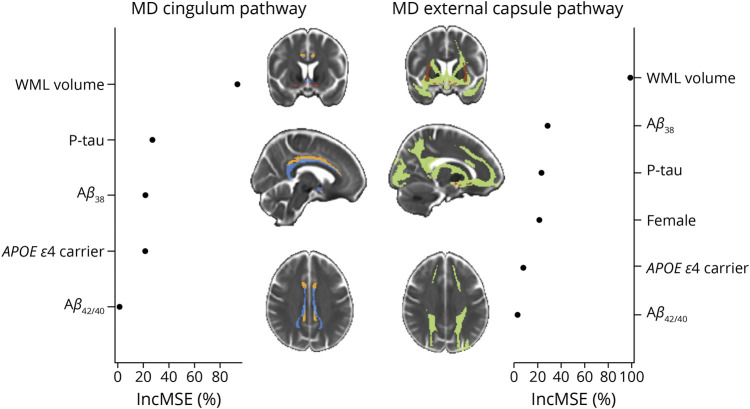
Figure 1. Contribution of Amyloid, Tau, and Cerebrovascular Biomarkers Toward the Integrity of Cholinergic WM Pathways.
The plot represents the percentage of increase in the prediction error (%IncMSE) when removing each variable from the random forest model. NBM ROI is represented in red. The cingulum pathway is represented in blue (orange for the cingulum mask). The external capsule pathway is represented in green (brown for the external capsule mask). Aβ38 = amyloid β38; Aβ42/40 = amyloid β42/40 ratio; P-tau = phosphorylated tau; WML volume = white matter lesions based on hypointense signal abnormalities of T1-weighted 3D images.

