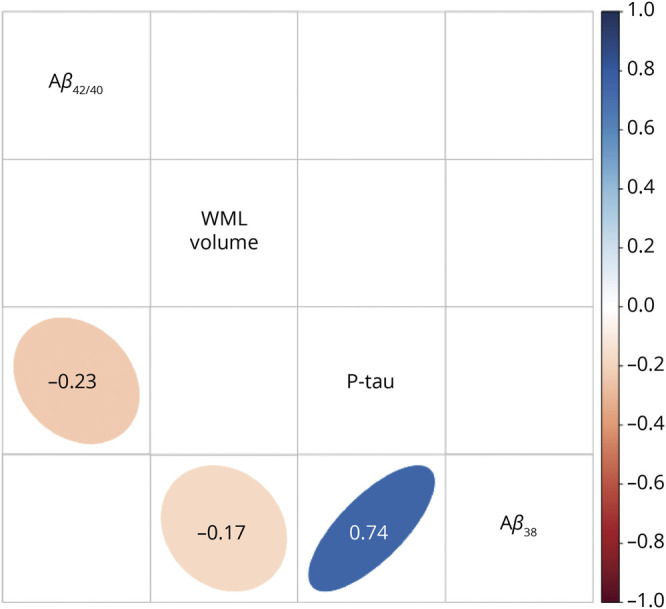
Figure 4. Correlation Matrix for the Predictors Included in the Random Forest Models.

Background of significant correlations (p < 0.05) was colored according to the value of the correlation coefficient and shaped accordingly to the association distribution, otherwise left empty.
