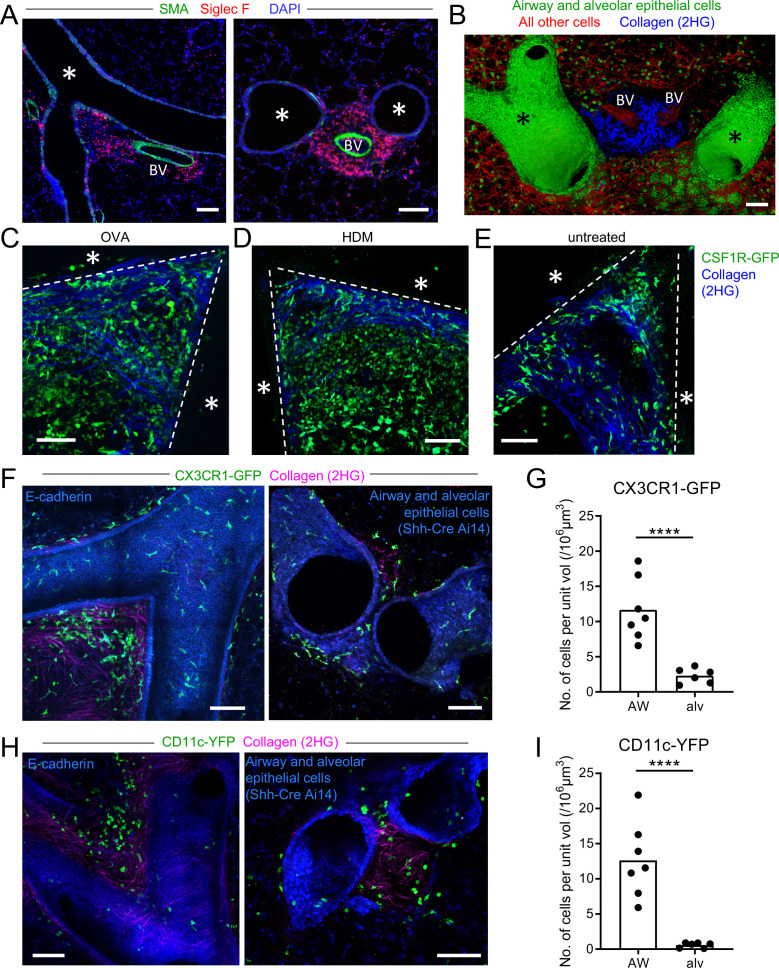
Figure 1. Myeloid cells are strategically positioned for surveillance of the airways.
(A) Representative immunofluorescence staining of thin cryostat sections of the lung from wild-type mice sensitized and challenged with OVA in a classical OVA model of allergic airway disease. Sections were stained with an antibody to smooth muscle actin (SMA, green) to differentiate between airways and blood vessels, and with an antibody to Siglec F (red) to visualize tissue eosinophils (Siglec-Fbright) and AMs (Siglec-Fint). Sections were stained with DAPI (blue) to visualize all nuclei. Airways (*) and blood vessels (BV) are labeled. (B) Representative 3D fluorescence opacity rendering of branching airways (*) and blood vessels (BV). The image is from a 516 μm z-stack collected by two-photon microscopy of a precision-cut thick vibratome slice of the lung from a naïve Shh-Cre ROSA26-mTmG mouse. Bronchial airway and alveolar epithelial cells express membrane-bound GFP (green), whereas all other cells express tdTomato (red). Collagen (blue) was visualized by second harmonic generation (2HG). (C, D, E) Representative two-photon microscopy images of precision-cut thick vibratome slices of the lungs of MacGreen (CSF1R-GFP, green) µMT mice that were treated with OVA (C) or HDM (D) allergic airway disease models, or were untreated (E). Maximum Intensity Projections (MIPs) representing z-stacks of 165 μm (C), 122.5 μm (D), and 127.5 μm (E) are shown. The bronchial airways were visualized by transmitted illumination and the approximate boundaries are denoted by dashed lines, with the airway lumen denoted by *. Collagen (blue) was visualized by 2HG. (F) Representative two-photon microscopy images of thick lung slices from mice expressing CX3CR1-GFP (green) together with E-cadherin-mCFP (left, blue) or Shh-Cre Ai14 (right, blue) to label airway epithelial cells. Collagen (magenta) was visualized by 2HG. MIPs representing z-stacks of 210 μm (left) and 142 μm (right) are shown. (G) Quantification of the density of CX3CR1-GFPbright cells located in tissue regions near the bronchial airways (AW) or alveoli (alv). (H) Representative two-photon microscopy images of thick lung slices from mice expressing CD11c-YFP (green) together with E-cadherin-mCFP (left, blue) or Shh-Cre Ai14 (right, blue) to label airway epithelial cells. Collagen (magenta) was visualized by 2HG. MIPs representing z-stacks of 231 μm (left) and 285 μm (right) are shown. (I) Quantification of the density of CD11c-YFP+ cells in tissue regions near the bronchial airways (AW) or alveoli (alv). Data are representative of 3 experiments (A), 4 experiments (B), 3 experiments (C), 2 experiments (D) >5 experiments (E), and ≥3 experiments (F, H). Images in (B–H) are stitched from tiled images. Each data point in (G, I) represents the quantification of cell density in one region of interest collected from six tiled images (AW) and five tiled images (alv) from five different lung lobes from four mice across three experiments. ****p<0.0001 (t-test). Scale bars, 100 μm.

