. 2022 Sep 29;11:e63296. doi: 10.7554/eLife.63296

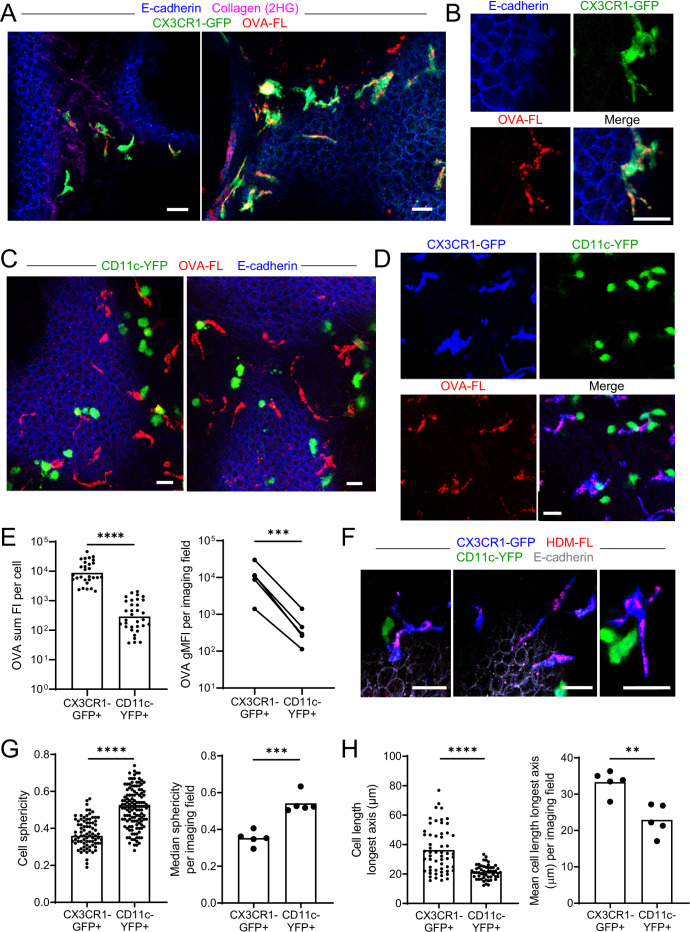
Figure 2. Antigen administered via the airways is captured by CX3CR1-GFPbright IMs.

(A–E) Fluorescent OVA (OVA-FL, red) was administered by intranasal droplet to naïve mice 45 min-2 hr prior to lung isolation. Precision-cut, thick vibratome sections were then imaged by two-photon microscopy. Shown are representative images of regions near the bronchial airways from mice expressing CX3CR1-GFP (green) and E-cadherin-mCFP (blue) (A, B), CD11c-YFP (green) and E-cadherin-mCFP (blue) (C) and CX3CR1-GFP (blue) and CD11c-YFP (green) (D). In (B) and (D), single color and merged color images of the regions are shown. Collagen (magenta) was visualized in (A) by 2HG. MIPs representing z-stacks of 6 μm (A, left), 21 μm (A, right), 9 μm (B), 24 μm (C, left), 22 μm (C, right), and 24 μm (D) are shown. (E) Quantification of OVA-FL uptake by CX3CR1-GFP+ versus CD11c-YFP+ cells; shown are the sum of the fluorescence intensity (FI) per cell (left) for a representative imaging field, and geometric mean fluorescence intensity (gMFI) per imaging field (right). (F) Fluorescent HDM extract (HDM-FL, red) was instilled intranasally to naïve mice expressing CX3CR1-GFP (blue), CD11c-YFP (green), and E-cadherin-mCFP (gray). MIPs representing z-stacks of 12–13 μm are shown. (G, H) Analysis of the shapes of CX3CR1-GFP+ and CD11c-YFP+ cells in naïve mice by quantifying sphericity (G) and the length of the longest cell axis (H). Data are shown for individual cells as well as the median (G) or mean (H) of cells in each imaging field analyzed. Data are representative of five experiments (A–B, D); two experiments (C,F); or were analyzed from five experiments (E, right), or four experiments (G–H). ** p<0.01, *** p<0.001, **** p<0.0001 (t-test). Scale bars, 20 μm.

Figure 2.

Figure 2—figure supplement 1. AMs in CX3CR1-GFP mice appear distinct from BAMs.

Figure 2—figure supplement 1.

Representative alveolar region in a lung slice from a mouse expressing CX3CR1-GFP (green) that was imaged by two-photon microscopy 2 hr after the intranasal administration of fluorescent antigen (OVA, red). Single color and merged MIP images depicting an 80 μm z-stack are shown. AMs (white arrows) are visible with a round morphology and capture large amounts of fluorescent OVA, yet exhibit only punctate autofluorescence in the GFP channel at our imaging settings. Data are representative of >5 experiments. Scale bar, 50 μm.
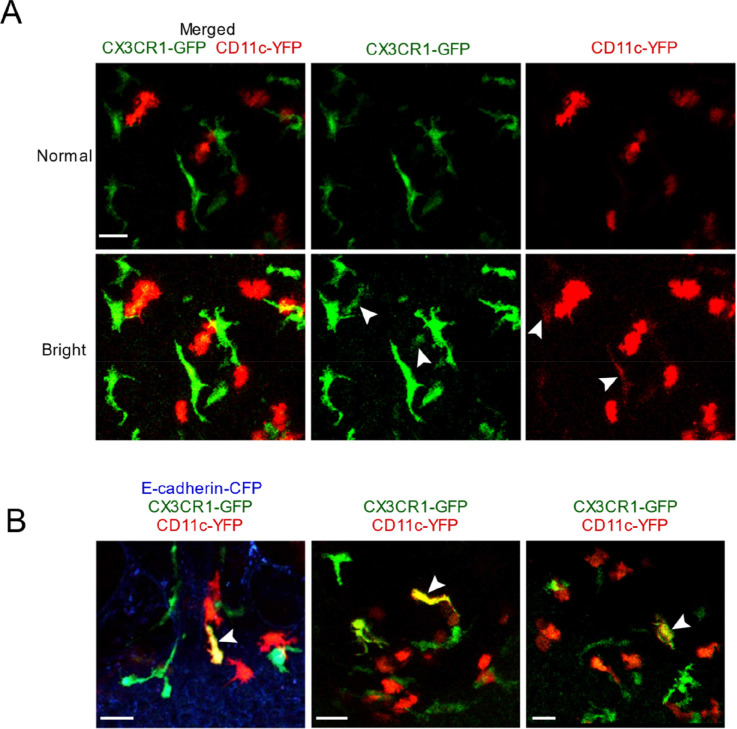
Figure 2—figure supplement 2. Characterization of the relative intensity of CX3CR1-GFP versus CD11c-YFP fluorescence.

Figure 2—figure supplement 2.

(A) Two different contrast adjustments are depicted of the same original image, shown as merged versus single color images. In the ‘normal’ settings (top row), the cells look exclusively CX3CR1-GFP+ (green) or CD11c-YFP+ (red), but when the contrast is increased (‘bright’ setting, second row) then dim CX3CR1-GFP expression is observed in some bright CD11c-YFP+ cells, and vice versa (white arrowheads). The MIP represents a 53 μm z-stack collected by two-photon microscopy of a precision-cut thick vibratome section from a naïve mouse. (B) Three images are shown depicting rare cells that have bright expression of both CX3CR1-GFP (green) and CD11c-YFP (red) reporters, and thus appear yellow (white arrowheads). The MIPs represent 60 μm (left) and 34 μm (middle, right) z-stacks collected by two-photon microscopy of precision-cut thick vibratome sections. Images are from independent experiments. Scale bars, 20 μm.
Figure 2—figure supplement 3. OVA-capturing BAMs do not express the CD11c-YFP reporter.

Figure 2—figure supplement 3.

Fluorescent OVA was administered by intranasal droplet to naïve mice 2–3 hr before lung isolation and enzymatic digestion. (A, B) Representative flow cytometric analysis (A) and quantification (B) of the intensity of OVA uptake in CX3CR1-GFPbright versus CD11c-YFPbright cells. Each data point represents one mouse (naïve). (C) Representative flow cytometric analyses of CX3CR1-GFP (upper histogram) versus CD11c-YFP (lower histogram) expression on OVAbright (OVA++) APCs. Cells were pre-gated to exclude AMs, B cells, and neutrophils. (D) Quantification of the frequency of CX3CR1-GFPbright versus CD11c-YFPbright cells among OVA++ cells. Note that the GFP and YFP reporters were analyzed in separate mice. Only the cells capturing the most OVA, and the cells with bright GFP or YFP expression were gated, corresponding to the cells visualized by microscopy. Each data point represents one mouse, and data are representative of three experiments. *** p<0.001, **** p<0.0001 (t-test).