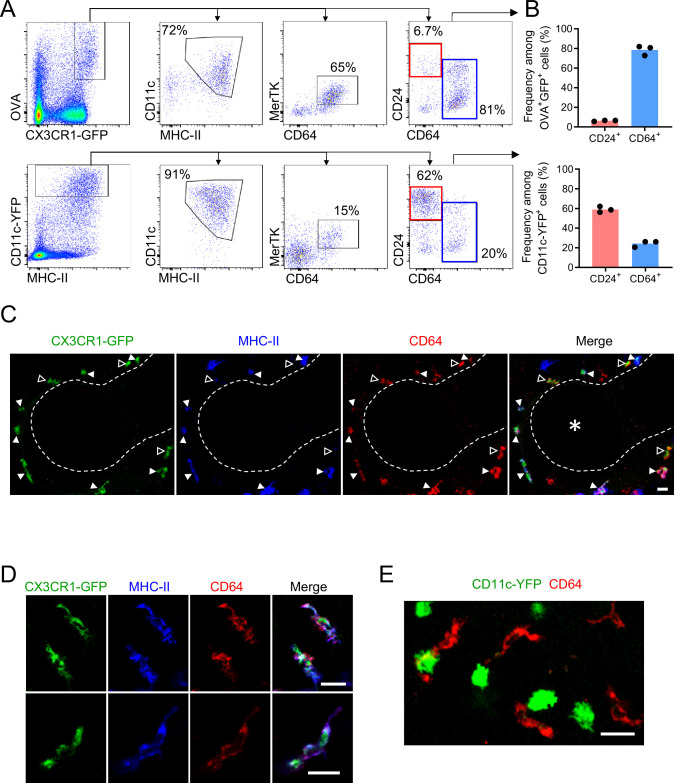
Figure 3. Antigen-capturing CX3CR1-GFPbright cells are Bronchus-Associated Macrophages (BAMs).
(A) Representative flow cytometric analysis of CX3CR1-GFPbright OVAbright cells (top) versus CD11c-YFPbright cells (bottom). Cells were pre-gated to exclude B cells, neutrophils, eosinophils, and AMs (CD19– Ly6G– Siglec-F–). (B) Quantification of the frequency of CD24+ CD64– (“CD24+”) or CD64+ CD24–/lo (“CD64+”) cells among CX3CR1-GFPbright OVAbright cells (top) or CD11c-YFPbright cells (bottom) that were gated as in (A). (C–D) Representative two-photon microscopy of MHC-II (blue) and CD64 (red) antibody staining in precision-cut vibratome lung sections from CX3CR1-GFP (green) mice, showing a region containing an airway as a 3D fluorescence opacity rendering of a 54 μm z-stack (C) as well as single z-plane images of cells to confirm colocalization of molecules (D); note C and D are from different imaging fields. In (C and D), single color and merged images are shown. In (C), the bronchial airway was visualized by transmitted illumination and the approximate boundaries are denoted by dashed lines, with the airway lumen denoted by * in the merged image. In (C), most CX3CR1-GFPbright CD64+ cells are MHC-IIhi (solid arrowheads), yet some cells are MHC-IIlo (open arrowheads). (E) Representative two-photon microscopy of CD64 antibody staining (red) in vibratome lung sections from CD11c-YFP (green) mice, showing a MIP of a 15 μm z-stack. Mice in all panels were unimmunized. Each data point represents one mouse (B). Data in all panels are representative of ≥2 experiments. Scale bars, 20 μm.


