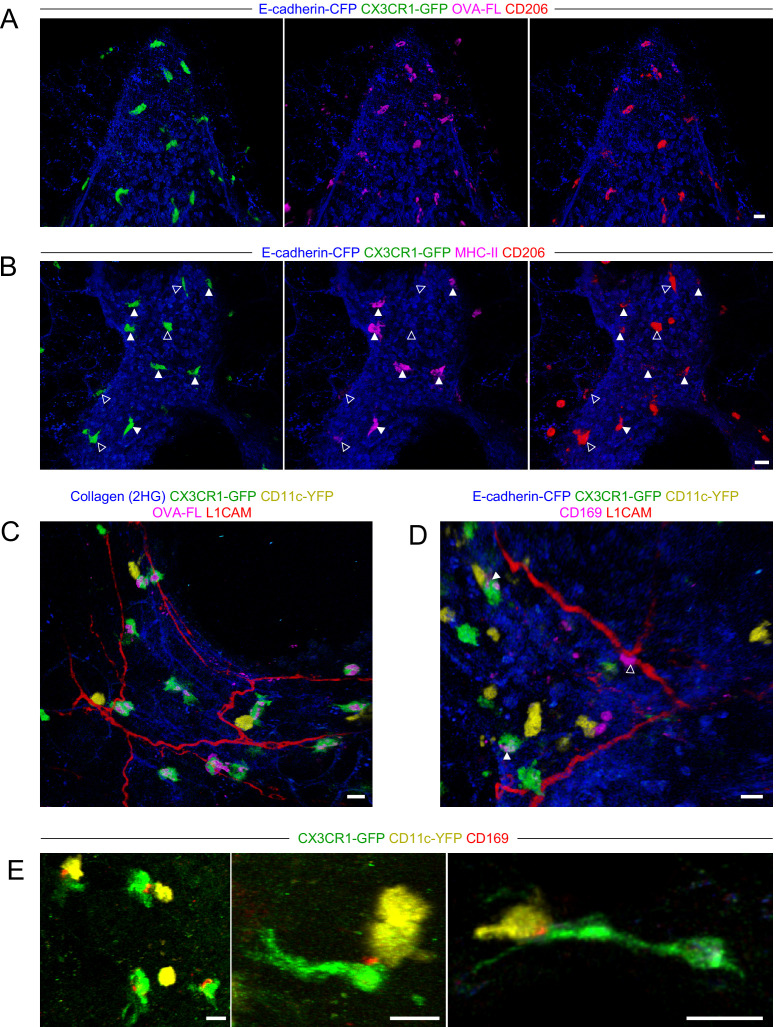
Figure 5. Characterization of BAM marker expression and positioning with respect to nerves.
Lungs were isolated from naïve mice expressing E-cadherin-CFP (blue), CX3CR1-GFP (green), and/or CD11c-YFP (yellow), as indicated. Some mice received fluorescent OVA (OVA-FL) 2 hr prior to imaging. Precision-cut lung slices were labeled with the indicated antibodies (see Methods for details) and then imaged by two-photon microscopy. Shown are 3D fluorescence opacity renderings of image stacks of regions adjacent to airways. (A, B) Comparison of CD206 staining (red) to OVA-FL uptake (magenta, A) and MHC-II staining (magenta, B). Separate two-color images (each color with E-cadherin-CFP) are shown for best visualization of the different fluorophores. In (B), CX3CR1-GFPbright MHC-IIhi cells are indicated by solid arrowheads and CX3CR1-GFPbright MHC-IIlo cells are indicated by open arrowheads. (C, D) Visualization of nerves with L1CAM staining (red) together with OVA-FL uptake (magenta, C) and CD169 staining (magenta, D). Merged color images are shown to enable clear visualization of spatial localization of cells with respect to nerves. In (D), punctate CD169 staining on BAMs is indicated by solid arrowheads, whereas a CX3CR1-GFPneg cell with uniform, bright CD169 staining adjacent to the nerve is shown with an open arrowhead. (E) Examples of punctate CD169 staining (red) on BAMs, often at the interface between BAMs and DCs. Images were derived from z-stacks of 182 µm (A), 102 µm (B), 127 µm (C), 219 µm (D), 165 µm (E, left), 124 µm (E, middle), and 7.5 µm (E, right). Scale bars, 20 µm.

