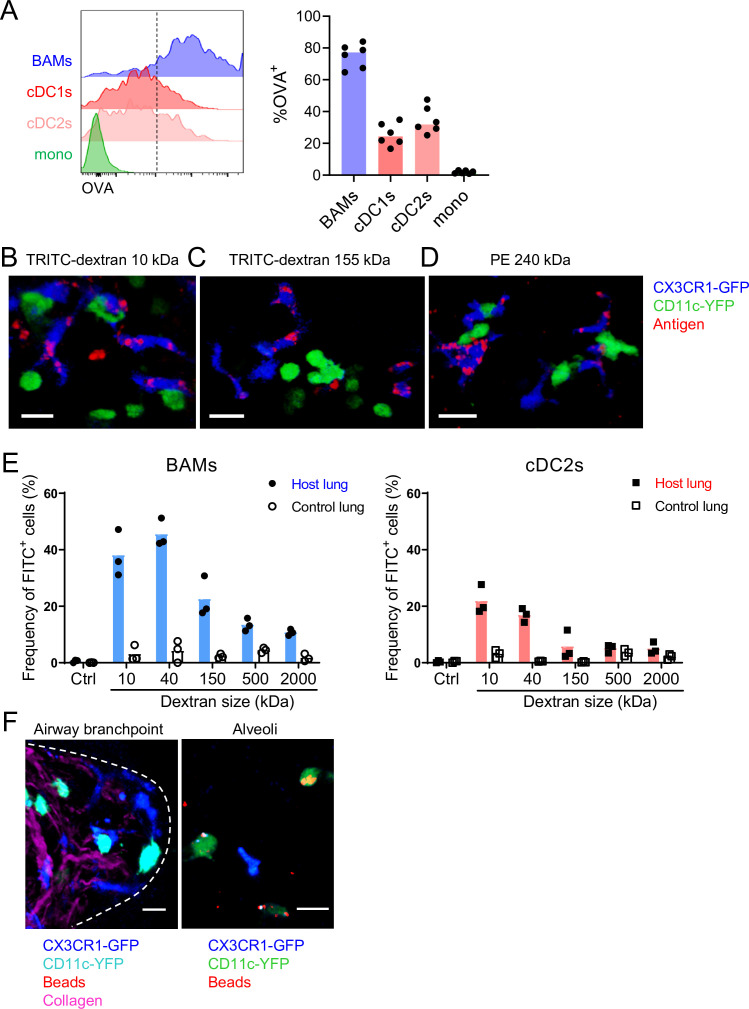
Figure 6. Characteristics of molecules captured by BAMs versus cDCs.
(A) Fluorescent OVA was administered by intranasal droplet to naïve mice 2 hr before lung isolation and enzymatic digestion. Representative flow cytometry (left) and quantification (right) of the frequency of OVA+ cells within each indicated cell subset. Cells were pre-gated to exclude B cells, neutrophils, eosinophils, and AMs (CD19– Ly6G– Siglec-F–). CD11c+ MHC-II+ cells were resolved into CD24+ cDCs versus CD64+ BAMs as in Figure 4A, and then the remaining cells that were not CD11c+ MHC-II+ cells were gated as CD11b+ to define monocytes (mono). cDC1s were gated as CD11b– CD103+ and cDC2s were gated as CD11b+ CD103– subsets of cDCs. Mice were either CX3CR1-GFP or CD11c-YFP mice. In CX3CR1-GFP mice, monocytes appeared as two subsets with low to intermediate GFP expression, consistent with classical and non-classical monocytes, respectively (data not shown). (B, C, D) The indicated fluorescent antigens (red) were administered by intranasal droplet to naïve CX3CR1-GFP (blue) X CD11c-YFP (green) mice 2–4 hr before lung isolation and the preparation of precision-cut thick lung sections. Representative images depict cells that captured the indicated fluorescent molecules in 3D fluorescence opacity renderings of 73 μm (B), 16 μm (C), and 51 μm (D) z-stacks collected by two-photon microscopy. DX, dextran; scale bars, 20 μm. (E) FITC-dextran of a range of sizes was administered by intranasal droplet to naïve mice, and then 2–3 hr later the lungs were isolated and enzymatically digested. The frequencies of FITC+ BAMs (left) and FITC+ cDC2s (right) were enumerated by flow cytometry as shown. To control for the possibility of FITC-dextran uptake during lung digestion and dissociation, the lungs from congenic mice that did not receive FITC-dextran were co-digested (‘control lung’) with the lungs of mice that had received FITC-dextran (‘host lung’). (F) Fluorescent beads (red) were administered to naïve mice expressing CX3CR1-GFP (blue) and CD11c-YFP (cyan, left or green, right). Representative two-photon microscopy images of an airway branchpoint (left) and alveoli (right) are shown. Images are MIPs of 107 μm (left) and 45 μm (right) z-stacks. Beads were primarily captured by AMs which appear dimly fluorescent in the YFP channel (note that the image of the alveoli [right] is adjusted to show the dimmer signal). Collagen (magenta) was visualized by 2HG. Each data point represents one mouse (A, E). Data are representative of two experiments (A–D). Similar results to (F) were observed in other experiments with smaller and larger beads. Scale bars, 20 μm.

