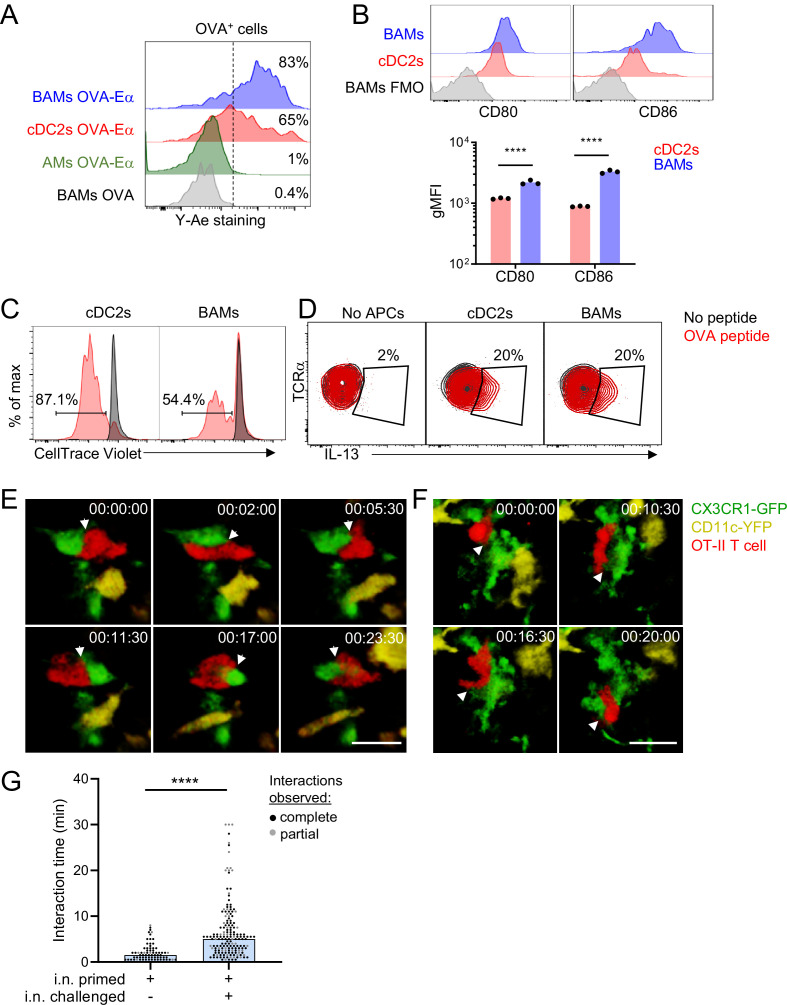
Figure 7. BAMs act as APCs and interact with CD4 effector T cells in the lung.
(A) Representative flow cytometric analysis of Y-Ae antibody staining to detect the presentation of MHC-II:Eα peptide complexes. OVA conjugated to Eα peptide was administered intranasally together with OVA-Alexa647 to fluorescently label antigen-capturing cells, and then after 17–18 hr to allow time for antigen processing and presentation, the lungs were isolated, followed by enzymatic digestion and analysis of Alexa647+ BAMs (blue), cDC2s (red) and AMs (green). Control mice received OVA without the Eα peptide (gray). (B) Representative flow cytometry (top) and quantification (bottom) of the surface expression of the co-stimulatory molecules CD80 and CD86 on BAMs (blue) and cDC2s (red) in the lungs of naïve mice in the steady state. FMO (gray), fluorescence minus one control. (C) Flow cytometric analysis of the proliferation of naïve OT-II T cells that were co-cultured for 2.5 days with sorted cDC2s or BAMs in the presence (red) or absence (black) of OVA peptide. Proliferation was assessed by dilution of CellTrace Violet. (D) Flow cytometric analysis of IL-13 production in Th2-polarized OT-II T cells that were cultured overnight with sorted cDC2s or BAMs, or no APCs as a control, in the presence (red) or absence (black) of OVA peptide, together with Brefeldin A. (E–G) Time-lapse images (E, F) and quantification (G) of CD4 T cell interactions with CX3CR1-GFP+ BAMs. OT-II T cells (red) expressing tdTomato (E) or CFP (F) were adoptively transferred to mice expressing CX3CR1-GFP (green) and CD11c-YFP (yellow) that had been sensitized with OVA and low-dose LPS intranasally, and then challenged with OVA alone intranasally 9–10 days later. Precision-cut thick vibratome sections of the lung were prepared for imaging 4–6 hr after OVA challenge, and two-photon microscopy z-stacks of 15 μm (E) and 22 μm (F) are shown. (G) Quantification of interaction times in which CX3CR1-GFP+ BAMs were in direct contact with OT-II T cells. Each data point represents a BAM-T cell interaction event. Due to the limitations of imaging in a specific volume over a fixed period of time, only some cellular interactions could be tracked for their entire duration from start to finish (complete, black dots), whereas other interactions could only be tracked for a portion of the total interaction time (partial, gray dots) and therefore are underestimates. Elapsed time is indicated as hh:mm:ss. Each data point represents one mouse (B). Data are representative of three experiments (A, D), two experiments (B, C), and five experiments (E–F). Data in (G) are pooled from three time-lapse imaging sessions from three separate experiments. ****p<0.0001 (Mann-Whitney test). Scale bars, 20 μm.

