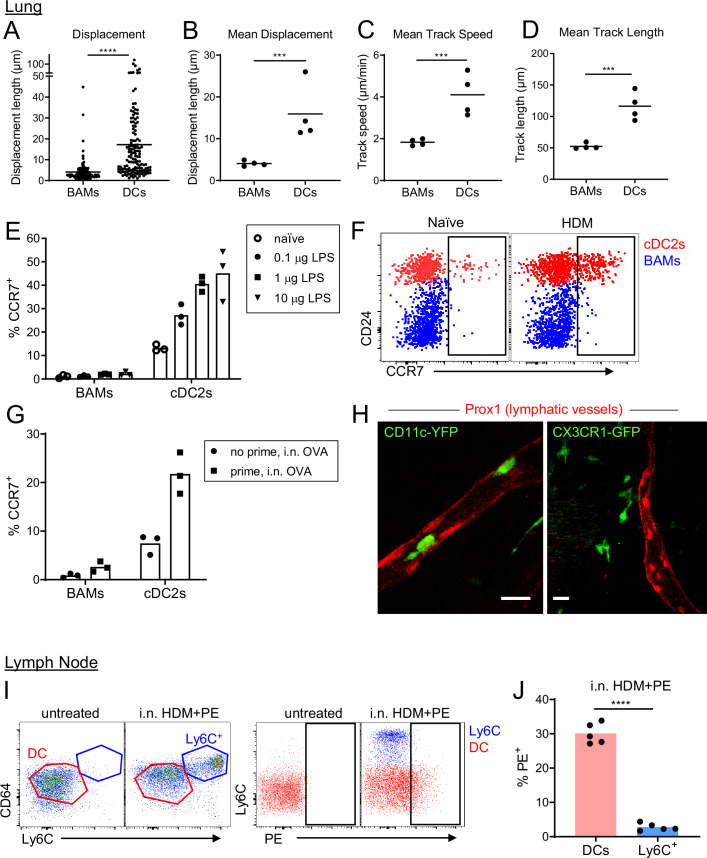
Figure 8. BAMs remain lung resident whereas DCs migrate to the draining lymph node.
(A–D) Motility measurements derived from time-lapse imaging of CX3CR1-GFP+ BAMs and CD11c-YFP+ DCs by two-photon microscopy of precision-cut thick lung sections from naïve mice. (E) Flow cytometric analysis of the frequency of CCR7+ cells among BAMs and cDC2s in the lung 4 hr after the indicated concentrations of LPS were administered intranasally. (F) Representative flow cytometry showing CCR7 expression on BAMs (blue) and cDC2s (red) in the lung 6 hr after intranasal HDM administration. (G) The frequency of CCR7+ cells among BAMs and cDC2s in the lung in mice that were naïve (‘no prime’) or had been primed 10 d earlier with intranasal OVA and 100 ng LPS (‘prime’), and were challenged once with intranasal OVA (i.n. OVA) without adjuvant. Lungs were excised 6 h after OVA challenge, enzymatically digested, and analyzed by flow cytometry. (H) Representative two-photon microscopy images of CD11c-YFP+ DCs (green) or CX3CR1-GFP+ BAMs (green) and lymphatic vessels (Prox1-tdTomato, red). Mice were administered intranasal LPS 2–4 hr before lung isolation, and then precision-cut thick lung slices were imaged for several hours. Images are MIPs of 41 μm (left) and 32 μm (right) z-stacks. (I) Representative flow cytometry gating in the lung-draining mediastinal lymph node in mice that were untreated or had been given HDM and PE intranasally 1 d earlier. Left, gating of cDCs (DC, red) and monocyte-derived cells (Ly6C+, blue). Cells were pregated as CD19– CD11c+ MHC-II+ CD11b+. Right, gating of PE+ cells. (J) Quantification of the frequency of PE+ cells among DCs and monocyte-derived cells (Ly6C+) gated as in (I) 1 d after HDM and PE were administered intranasally. Each data point represents an individual cell, pooled from four time-lapse image sequences (A); the average of all cells from one time-lapse image sequence (B, C, and D); or one mouse (E, G, J). Data are from 2 experiments (A–D) or are representative of two experiments (E, F, I, J). Similar results to the primed mice shown in (G) were observed 1 d after OVA challenge, and similar results for CD11c-YFP cells shown in (H) were observed with HDM treatment. *** p<0.001, **** p<0.0001 (t-test). Scale bars, 20 μm.
Figure 8—figure supplement 1. Comparison of Ly-6C surface expression on BAMs, DCs, and monocytes.


