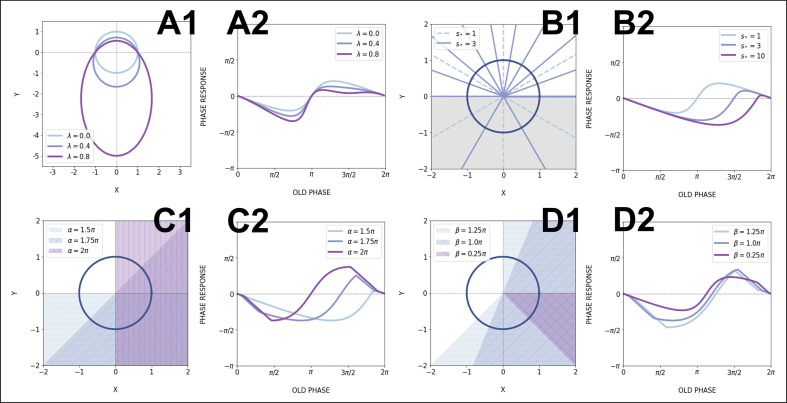
Appendix 1—figure 4. Effects of model parameters on the phase response curve (PRC).
(A) Effect of eccentricity : (A1) Increasing makes the limit cycle more elongated, while keeping the upper focus at the origin. (A2) The positive part of the PRC is then flattened; for all PRCs here (no acceleration). (B) Effect of speeding up : (B1) When is increased, the spacing between isochrons in the sped up region increases, so this region contains less and less isochrons. Shown here is the case when the acceleration happens in the lower half-plane (, ), which is shaded in gray. (B2) The effect on the PRC is to shrink the portion where the oscillator is sped up, thus emphasizing the other part of the curve. Here, . (C, D) Effects of the sped up sector parameters : the location and width of the sector determine which parts of the PRC get rescaled. (C1) The shaded regions are sectors with different values of and . (C2) The corresponding PRCs with,.. (D1) Sped up sectors located at with different widths . (D2) The corresponding PRCs for the case .. All PRCs in this figure were computed with perturbation amplitude .

