. 2022 Oct 12;11:e79575. doi: 10.7554/eLife.79575

Figure 4. Effect of varying DAPT concentrations on entrainment dynamics.

(A) Left: Detrended (via sinc filter detrending) timeseries of the segmentation clock in 2D-assays entrained to 170 min periodic pulses of either 1 or 2 µM DAPT, zoomed in from 500 to 950 min. Periodic pulses are indicated as magenta bars and the timeseries of each sample (for 1 µM: n=18 and N=5, for 2 µM: n=34 and N=8) is marked with a dashed line. The median of the oscillations is represented here as a solid line, while the gray shaded area denotes the interquartile range. Right: Detrended (via sinc filter detrending) timeseries of the segmentation clock in 2D-assays entrained to 170 min periodic pulses of either 1 µM (n=18 and N=5) or 2 µM (n=18 and N=8) DAPT represented as heatmaps, generated using PlotTwist (Goedhart, 2020). Periodic pulses are indicated as magenta bars. Each row corresponds to a sample. (B) Period evolution during entrainment, obtained from wavelet analysis. The period evolution for each sample and the median of the periods are represented here as a dashed line and a solid line, respectively. The gray shaded area corresponds to the interquartile range. The plot for the 2 µM condition is the same as the plot for the DAPT condition in Figure 3B. Magenta dashed line marks Tzeit. (C) Evolution of first Kuramoto order parameter (R) in magenta and circular standard deviation (circSD) in green over time, showing change in coherence of multiple samples during the experiment. An R equal to 1.0 means that samples are in-phase. circSD is equal to -2lnR. (D) Polar plots at different timepoints showing phase of each sample and their first Kuramoto order parameter, represented as a magenta dot along the circumference of a circle and a magenta line segment at the circle’s center, respectively. A longer line segment corresponds to a higher first Kuramoto order parameter, and thus to more coherent samples. The direction of the line denotes the vectorial average of the sample phases. Time is indicated as minutes elapsed from the start of the experiment.

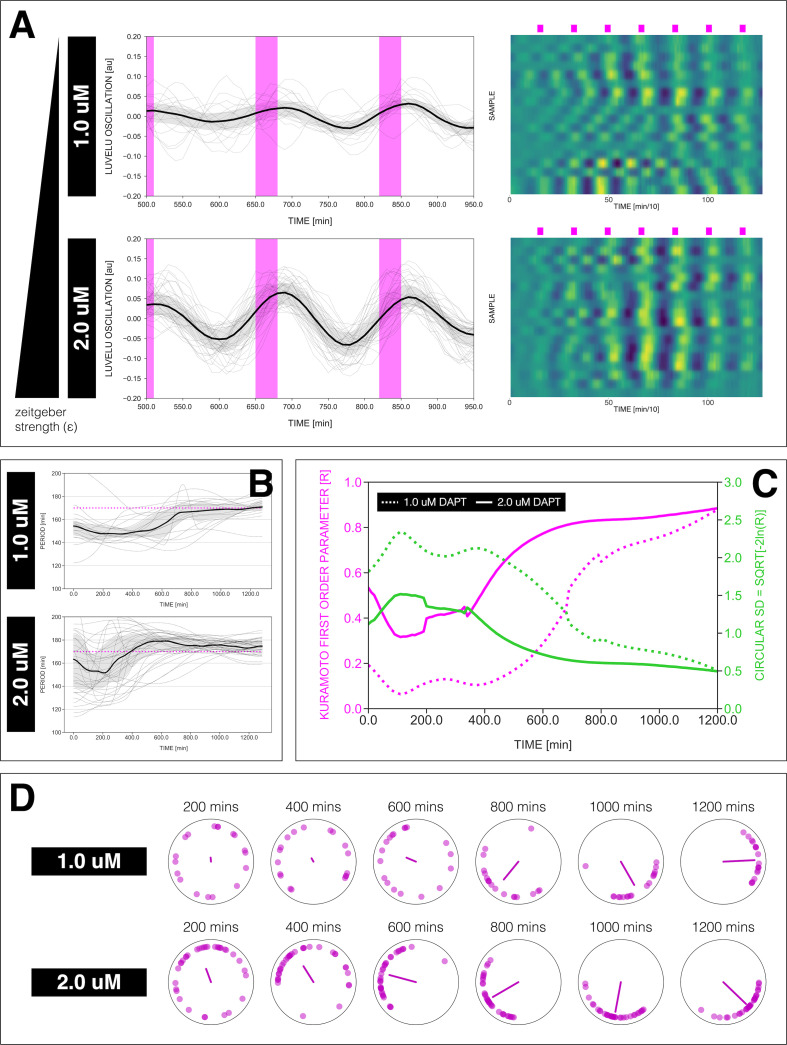
Figure 4.

Figure 4—figure supplement 1. Changing the concentration of DAPT affects entrainment.

Figure 4—figure supplement 1.

Changing the concentration of DAPT, equivalent to changing zeitgeber strength, affects entrainment of the segmentation clock to 130 min periodic DAPT pulses. (A) Left: Detrended (via sinc filter detrending) timeseries of the segmentation clock in 2D-assays entrained to 130 min periodic pulses of either 0.5, 1, or 2 µM DAPT, zoomed in from 500 to 950 min. Periodic pulses are indicated as magenta bars and the timeseries of each sample (for 0.5 µM: n=9 and N=2, for 1 µM: n=20 and N=4, for 2 µM: n=39 and N=10) is marked with a dashed line. The median of the oscillations is represented here as a solid line, while the gray shaded area denotes the interquartile range. Right: Period evolution during entrainment, obtained from wavelet analysis. The period evolution for each sample and the median of the periods are represented here as a dashed line and a solid line, respectively. The gray shaded area corresponds to the interquartile range. Magenta dashed line marks Tzeit. (B) Polar plots at different timepoints showing phase of each sample and their first Kuramoto order parameter, represented as a magenta dot along the circumference of a circle and a magenta line segment at the circle’s center, respectively. A longer line segment corresponds to a higher first Kuramoto order parameter, and thus to more coherent samples. The direction of the line denotes the vectorial average of the sample phases. Time is indicated as minutes elapsed from the start of the experiment.
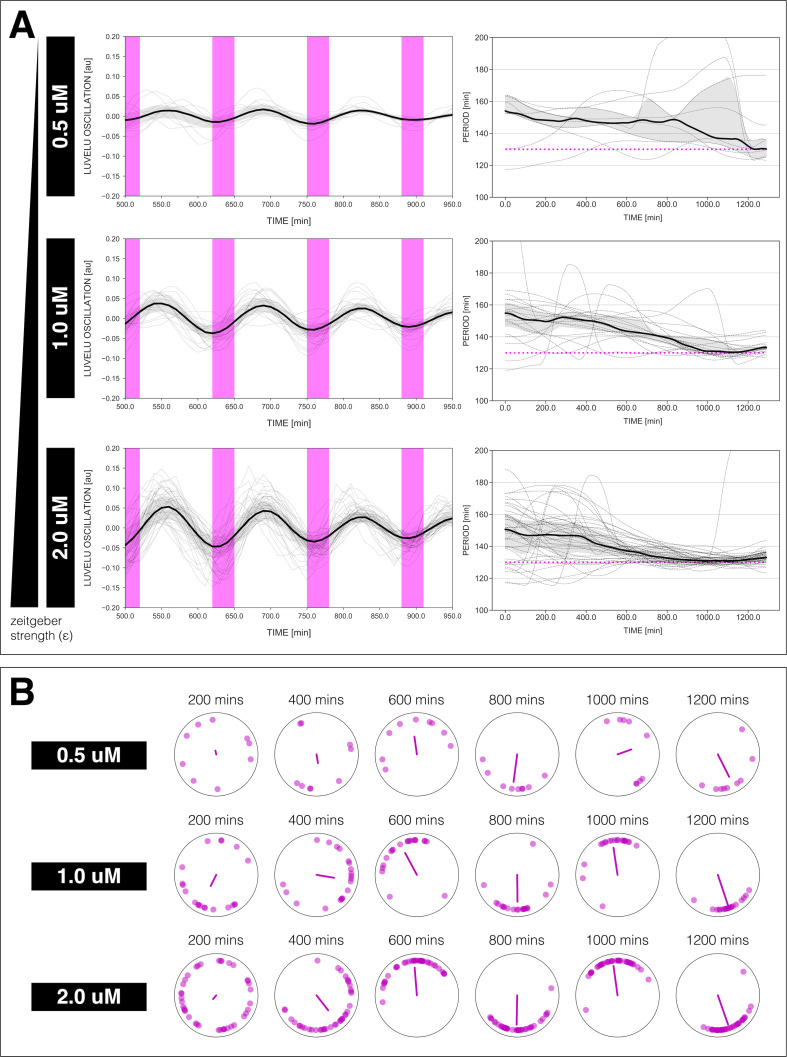
Figure 4—figure supplement 2. Dynamics and variability of entrainment.

Figure 4—figure supplement 2.

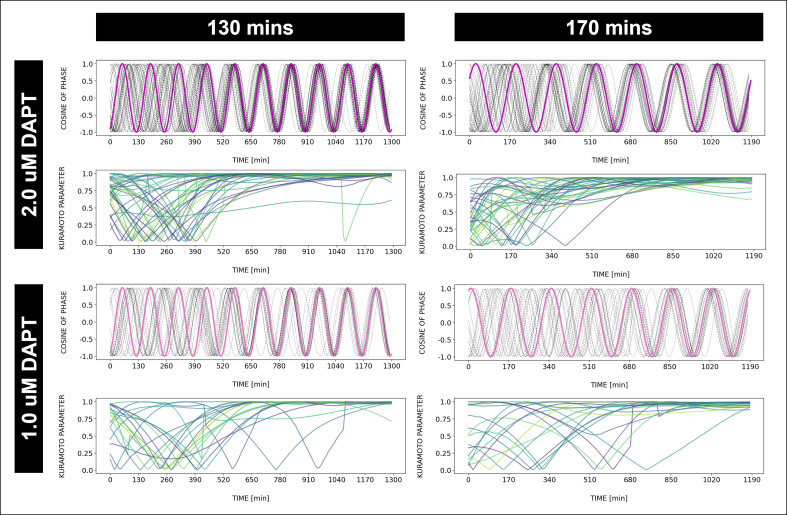
Dynamics and variability of entrainment. We represent the zeitgeber signal as a continuous uniformly increasing phase (‘zeitgeber time’) with period Tzeit. The initial condition for ϕzeit is chosen so that the zeitgeber phase at the moment of the last pulse is matching the experimental entrainment phase for each Tzeit. We plot the corresponding cosϕ(t) for each sample (dotted lines) and the zeitgeber phase (solid lines). To quantify how well each sample is following the zeitgeber, we compute the Kuramoto parameter: Rj(t)=12|expiϕj(t)+expiϕzeit(t)|, where ϕj(t) is the phase of sample j. Convergence to 1 of the Kuramoto parameter Rj indicates the establishment of a stable phase relation between the sample and zeitgeber pulses, indicative of entrainment. As seen from the plots, at lower concentration of DAPT samples take a longer time on average to reach entrainment.