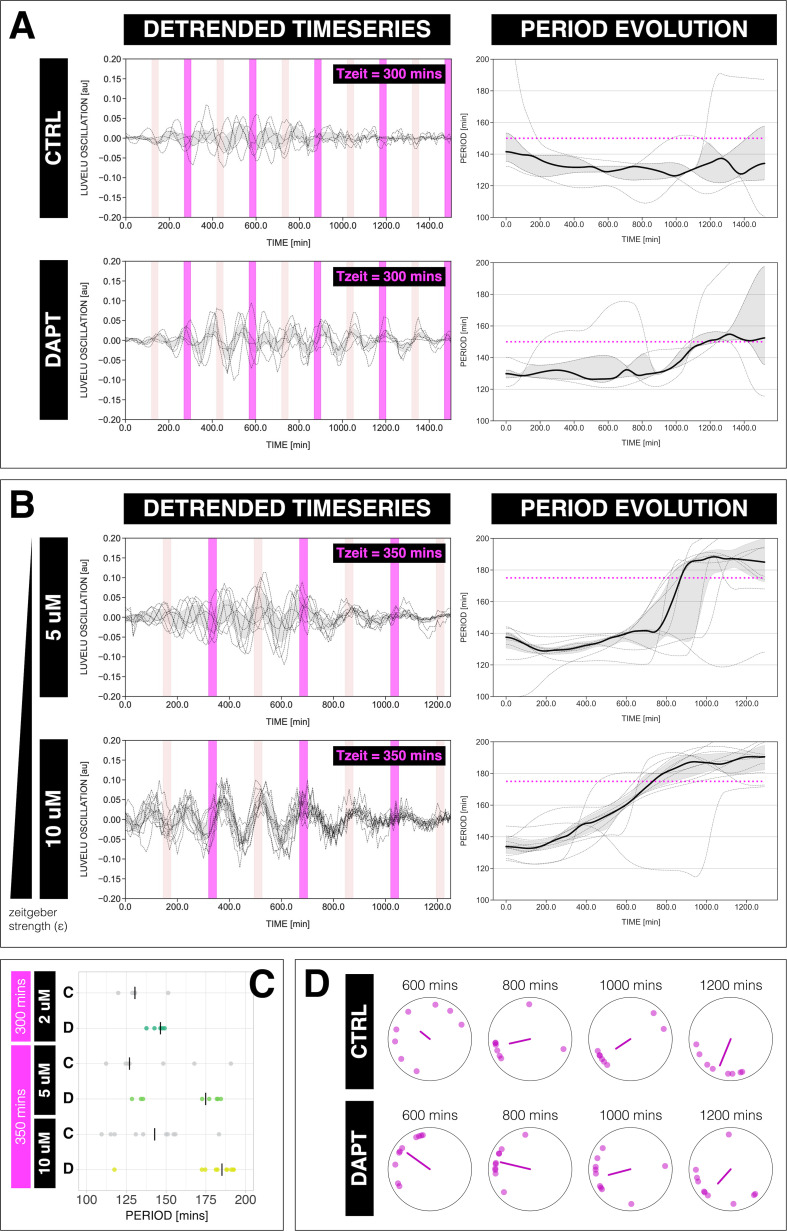
Figure 5. The segmentation clock can be entrained to a higher order.
(A) Left: Detrended (via sinc filter detrending) timeseries of the segmentation clock in 2D-assays subjected to 300 min periodic pulses of 2 µM DAPT (or DMSO for controls). Periodic pulses are indicated as magenta bars and the timeseries of each sample (for CTRL: n=5 and N=1, for DAPT: n=5 and N=1) is marked with a dashed line. The gray shaded area denotes the interquartile range. Hypothetical pulses at half the zeitgeber period are indicated as light pink bars. Right: Period evolution during entrainment, obtained from wavelet analysis. The period evolution for each sample and the median of the periods are represented here as a dashed line and a solid line, respectively. The gray shaded area corresponds to the interquartile range. Magenta dashed line marks . (B) Left: Detrended (via sinc filter detrending) timeseries of the segmentation clock in 2D-assays subjected to 350 min periodic pulses of either 5 µM DAPT or 10 µM DAPT. Periodic pulses are indicated as magenta bars and the timeseries of each sample (for 5 µM DAPT: n=8 and N=2, for 10 µM DAPT: n=10 and N=2) is marked with a dashed line. The gray shaded area denotes the interquartile range. Hypothetical pulses at half the zeitgeber period are indicated as light pink bars. Right: Period evolution during entrainment, obtained from wavelet analysis. The period evolution for each sample and the median of the periods are represented here as a dashed line and a solid line, respectively. The gray shaded area corresponds to the interquartile range. Magenta dashed line marks . (C) Mean period either from 1000 to 1150 min (for min) or from 800 to 950 min (for min) after start of the experiment of samples subjected to periodic pulses of DAPT (or DMSO for controls). Each sample is represented as a dot, while the median of all samples is denoted as a solid vertical line. For 300 min 2 µM DAPT: (CTRL: n=5 and N=1) and (DAPT: n=5 and N=1) with p-value = 0.191, for 350 min 5 µM DAPT: (CTRL: n=7 and N=2) and (DAPT: n=8 and N=2) with p-value = 0.049, for 350 min 10 µM DAPT: (CTRL: n=10 and N=2) and (DAPT: n=10 and N=2) with p-value = 0.016. The period and concentration of the DAPT pulses are specified. Data were visualized using PlotsOfData (Postma and Goedhart, 2019). To calculate p-values, two-tailed test for absolute difference between medians was done via a randomization method using PlotsOfDifferences (Goedhart, 2019). (D) Polar plots at different timepoints showing the phase of each sample in (A) and the first Kuramoto order parameter, represented as a magenta dot along the circumference of a circle and a magenta line segment at the circle’s center, respectively. A longer line segment corresponds to a higher first Kuramoto order parameter, and thus to more coherent samples. The direction of the line denotes the vectorial average of the sample phases. Time is indicated as minutes elapsed from the start of the experiment.

