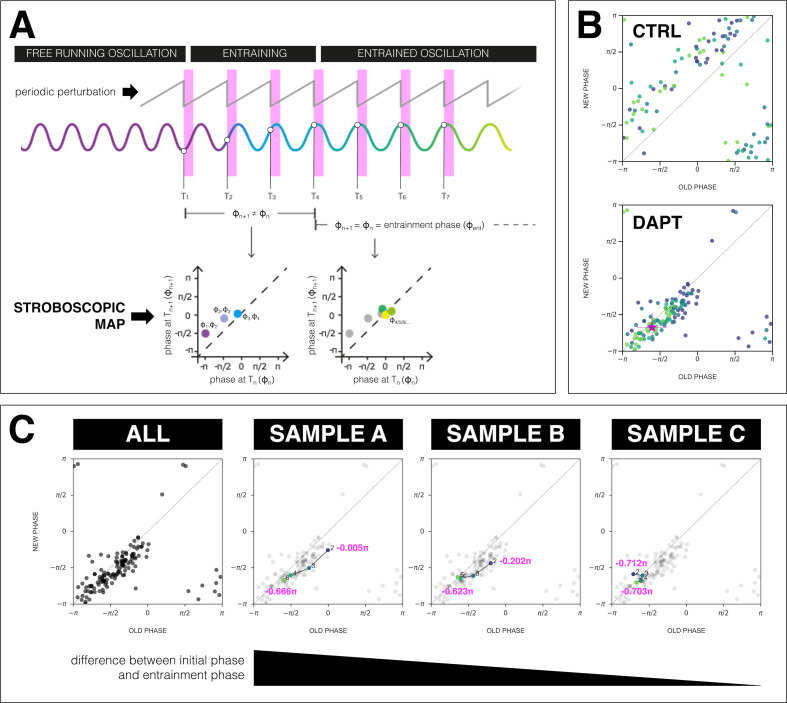
Figure 6. The segmentation clock establishes a stable phase relationship with the zeitgeber.
(A) Schematic of how to generate a stroboscopic map, where the phase of the segmentation clock just before a DAPT pulse (old phase, ) is iteratively plotted against its phase just before the next pulse (new phase, ).The position of each point in a stroboscopic map thus denotes a stepwise change in phase of the segmentation clock as it undergoes entrainment to the zeitgeber. Upon entrainment and phase-locking, the new phase is equal to the old phase, thus marking a point that lies on the diagonal of the stroboscopic map. This point on the diagonal is the entrainment phase (). Illustration by Stefano Vianello. (B) Stroboscopic map of samples subjected to 170 min periodic pulses of 2 µM DAPT (or DMSO for controls). Colors mark progression in time, from purple (early) to yellow (late). Note that while in control samples, points remain above the diagonal (reflecting that endogenous oscillations run faster than min as shown in Figure 3B–C), in entrained samples, the measurements converge toward a point on the diagonal (i.e. the entrainment phase, ), showing phase-locking. This localized region marks the entrainment phase (). This is highlighted with a magenta star, which corresponds to the centroid . The centroid was calculated from the vectorial average of the phases of the samples at the end of the experiment, where xc = vectorial average of old phase, yc = vectorial average of new phase. The spread of the points in the region is reported in terms of the circular standard deviation (, where is the first Kuramoto order parameter). (C) Stroboscopic maps of the segmentation clock entrained to 170 min periodic pulses of 2 µM DAPT (n=34 and N=8), for all samples (ALL) and for three individual samples (SAMPLE A, SAMPLE B, SAMPLE C). The numbers and colors (from purple to yellow) denote progression in time. The initial phase (old phase at point 2) and the entrainment phase (new phase at point 5) of each sample are specified.

