. 2022 Oct 12;11:e79575. doi: 10.7554/eLife.79575

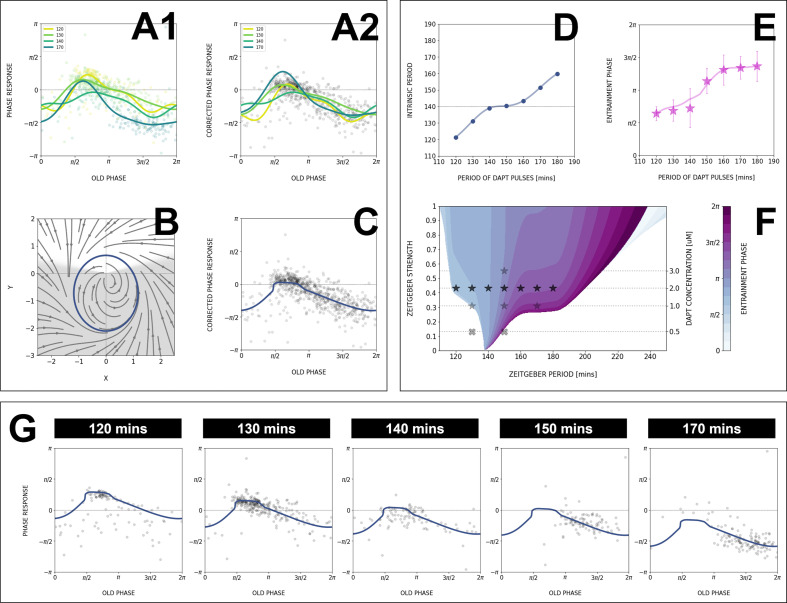
Figure 8. Modeling the segmentation clock entrainment response.

(A) Phase response curve (PRC) from the data for different zeitgeber periods. (1) PRCs calculated at different Tzeit (points) and Fourier series fitted to them (lines). (2) Original PRCs are shifted vertically to collapse the data points on one curve. (B) Oscillator model, optimized by fitting the vertically shifted PRC. The limit cycle is an ellipse (blue) with eccentricity λ=0.5, the region with speeding up s*=5.6 is shaded. (C) Optimized model PRC (line) overlaid to the vertically shifted data points. (D) Modeled intrinsic period Tosc as a function of entrainment period Tzeit. Points were inferred from the PRCs data in A1 by matching the detuning and entrainment phase ϕent, the function was interpolated with cubic splines. (E) Entrainment phase ϕent from the model with changing intrinsic period (line) agrees with the experimental data (points and error bars). Experimental data are the same as those in Figure 7B. (F) 1:1 Arnold tongue and isophases calculated with the model. Stars correspond to experimental data (Tzeit,ϵ) with observed entrainment, in agreement with ϕent data for different DAPT concentrations (Figure 8—figure supplement 4A). Black stars represent the experiments used for optimizing the model. Crosses correspond to experimental conditions with no entrainment. (G) Fit of the model (solid lines) overlaid with experimental phase differences (dots) at different periods Tzeit.

Figure 8.

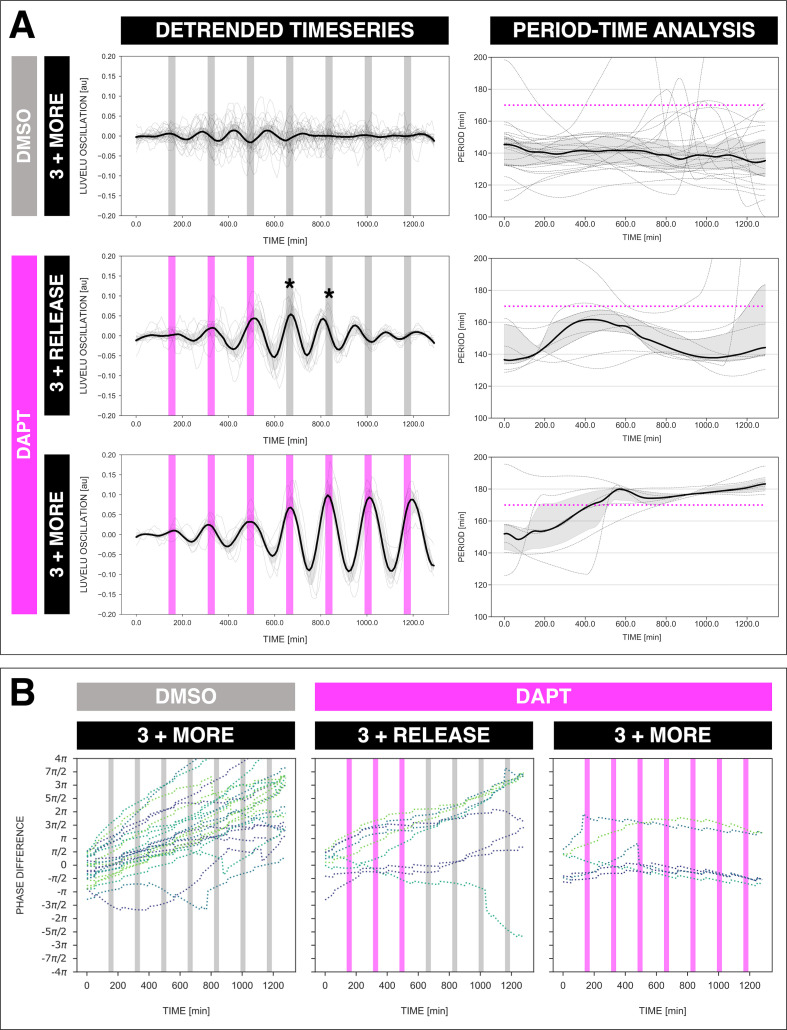
Figure 8—figure supplement 1. The segmentation clock keeps its adjusted rhythm a few cycles after release from the zeitgeber.

Figure 8—figure supplement 1.

The segmentation clock keeps its adjusted rhythm even a few cycles after release from DAPT pulses.
(A) Left: Detrended (via sinc filter detrending) timeseries of the segmentation clock in 2D-assays subjected to 170 min periodic pulses of DMSO (gray bars) and/or 2 µM DAPT (magenta bars). The timeseries of each sample (for continuous DMSO pulses: n=24 and N=7, for three DAPT pulses and then release: n=9 and N=2, for continuous DAPT pulses: n=6 and N=2) is marked with a dashed line. The median of the oscillations is represented here as a solid line, while the gray shaded area denotes the interquartile range. Right: Period evolution during entrainment, obtained from wavelet analysis. The period evolution for each sample and the median of the periods are represented here as a dashed line and a solid line, respectively. The gray shaded area corresponds to the interquartile range. Magenta dashed line marks Tzeit. Data for the continuous DMSO pulses are the same as the controls in Figure 3A–B. (B) Phase difference between the segmentation clock and the drug pulses. Note that a phase of −π/2 is equivalent to a phase of 3π/2, and a phase of 0 is equivalent to a phase of 2π. Periodic pulses of DMSO and 2 µM DAPT are indicated as gray bars and as magenta bars, respectively. Each sample within each condition is marked with different colors.
Figure 8—figure supplement 2. Phase response as a function of time.

Figure 8—figure supplement 2.

We use the color code for pulse number similar to Figure 6 (from purple for early pulses to yellow for later pulses). In the phase response curve (PRC) from the 120 min (170 min) experiment later data points are located higher (lower) than earlier data points, consistent with the change of the intrinsic period of oscillations during entrainment. The adjustment of the intrinsic period decreases the detuning, causing the vertical shift of the phase response curve.
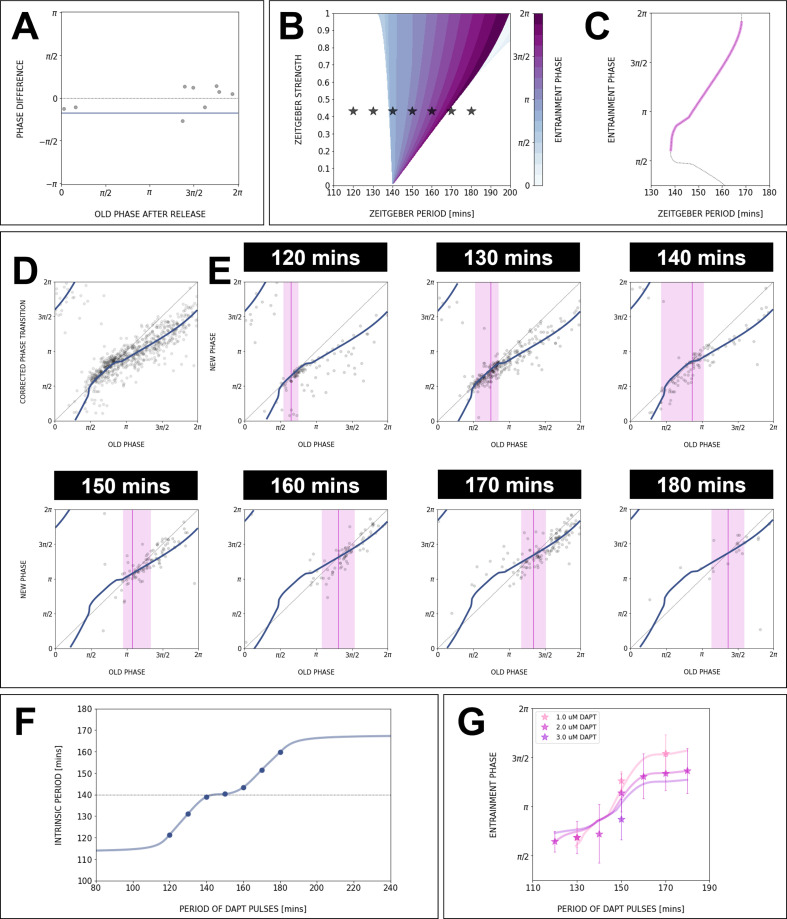
Figure 8—figure supplement 3. The model captures phase response curve (PRC)/phase transition curve (PTC), stroboscopic maps, and entrainment phase.

Figure 8—figure supplement 3.

Data for the PRC/PTC, stroboscopic maps, and entrainment phase can be fully captured with our model and changing intrinsic period.
(A) Stroboscopic map data from release experiments allows to estimate the intrinsic oscillation period during entrainment. With Tzeit=170 min and Tosc=150 min, the phase difference between the end and the beginning of the first full cycle with no perturbations is on average 0 (2π). The data points are from different release experiments with Tzeit=170 min. If the natural period of 140 min is used, the average phase difference is -0.17π (solid line). (B, C) Constant intrinsic period Tosc is not consistent with experimental data: (B) The 1:1 Arnold tongue, computed using our model and Tosc=140 min, is much narrower than the experimental entrainment range. Stars correspond to experimental conditions (Tosc, A) where entrainment was observed. (C) Entrainment phase ϕent(Tzeit) numerically computed with the optimized PRC from Figure 8C, assuming constant Tosc= 140 min (which also corresponds to a cross-section of the isophases in B). Clearly, the slope of the curve is much higher than in the data. For comparison, we also plot the Figure 8C PRC rotated by π/2, showing perfect overlap. (D) PTC of the optimized model (equivalent to the PRC shown in Figure 8C). (E) Using the PTC from D, we fit the stroboscopic maps data for all periods Tzeit by choosing the Tosc(Tzeit) that gives the right detuning. The narrow magenta lines indicate the entrainment phase, the fixed point of each fitted stroboscopic map. The shaded magenta regions show the experimental range for entrainment phase. (F) Extrapolation of the intrinsic oscillator period Tosc as a function of zeitgeber period Tzeit. (G) Cross-sections of the isophases in Figure 8F, calculated with the model and the extrapolated curve for Tosc(Tzeit), give excellent agreement with the entrainment phase data for different concentrations of DAPT.
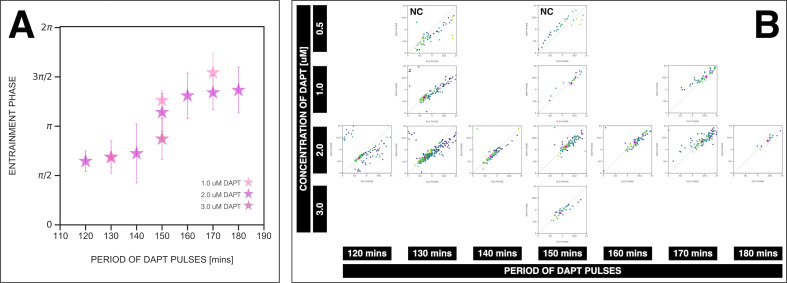
Figure 8—figure supplement 4. Zeitgeber period and strength affect the entrainment phase.

Figure 8—figure supplement 4.

Zeitgeber period and zeitgeber strength affect the entrainment phase of the segmentation clock. (A) Entrainment phase at different periods of DAPT pulses (i.e. zeitgeber period) and different drug concentrations (i.e. zeitgeber strength). Entrainment phase (ϕent) was calculated from the vectorial average of the phases of phase-locked samples at the time corresponding to last considered DAPT pulse. A sample was considered phase-locked if the difference between its phase at the time of the final drug pulse considered and its phase one drug pulse before is less than π/8 – for 120 min: (2 µM: n=13/14 and N=3/3), for 130 min: (1 µM: n=17/20 and N=4/4), (2 µM: n=38/39 and N=10/10), for 140 min: (2 µM: n=10/15 and N=3/3), for 150 min: (1 µM: n=3/4 and N=1/1), (2 µM: n=16/17 and N=4/4), (3 µM: n=5/5 and N=1/1), for 160 min: (2 µM: n=11/15 and N=3/3), for 170 min: (1 µM: n=12/18 and N=4/5), (2 µM: n=28/34 and N=8/8), for 180 min: (2 µM: n=4/6 and N=1/1). The spread of ϕent between samples is reported in terms of the circular standard deviation (-2lnR, where R is the first Kuramoto order parameter). Colors mark concentration of DAPT. Drug pulse duration was kept constant at 30 min/cycle. (B) Stroboscopic maps for different values of zeitgeber period and zeitgeber strength placed next to each other. The localized region close to the diagonal in each map marks ϕent for that condition. This is highlighted with a magenta star, which corresponds to the centroid of the said region. The centroid (xc,yc) was calculated from the vectorial average of the phases of phase-locked samples at the end of the experiment, where xc = vectorial average of old phase, yc = vectorial average of new phase. The spread of the points in the region is reported in terms of the circular standard deviation (-2lnR, where R is the first Kuramoto order parameter). The period of the DAPT pulses and the concentration of DAPT are indicated. Colors mark progression in time, from purple to yellow. NC means not considered (in plotting A) because no/small fraction of samples was phase-locked – for 0.5 µM 130 min: n=4/9 and N=2/2, for 0.5 µM 150 min: n=0/6 and N=0/1. Stroboscopic maps for these NC conditions include all samples, unlike the other conditions where only phase-locked samples are plotted. Data for 2 µM condition is the same as that in Figure 7A–B.