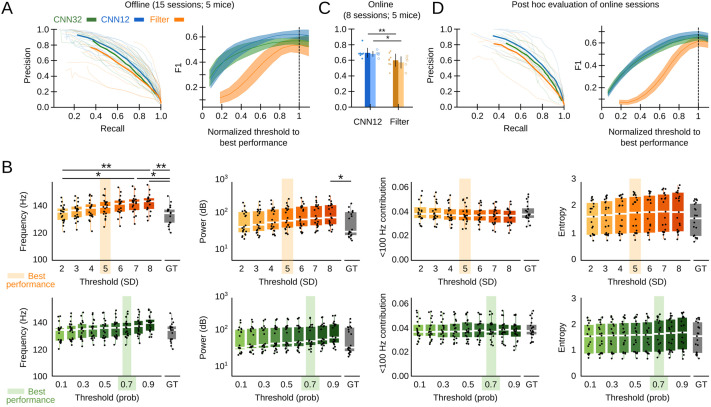
Figure 2. Convolutional neural network (CNN) performance.
(A) Offline P-R curve (mean is dark; sessions are light) (left), and F1 score as a function of normalized thresholds for the CNN at 32 and 12.8 ms resolution as compared with the Butterworth filter (right). Data reported as mean±95% confidence interval for validation sessions (n=15 sessions; five mice). (B) Comparison of mean sharp-wave ripple (SWR) features (frequency, power, high-frequency band contribution, and spectral entropy) of events detected offline by the filter (upper plots) and the CNN32 (bottom) as a function of the threshold. The mean best threshold is indicated (5SD for the filter, 0.7 probability for the CNN). Note effect of the threshold in the mean frequency value (Kruskal-Wallis, Chi2(7)=30.5, p<0.0001; post hoc tests *, p<0.05; **, p<0.001) and the power (Kruskal-Wallis, Chi2(7)=16.4, p=0.0218) for the filter but not for the CNN. Note also, differences against the mean value in the ground truth (GT). Mean data from n=15 sessions; five mice. (C) Online detection performance of CNN12 as compared with the Butterworth filter (n=8 sessions, t-test p=0.0047; n=5 mice, t-test p=0.033). (D) Mean and per session P-R curve (left), and F1 score as a function of the optimized threshold for online sessions, as analyzed post hoc (right). Data from n=8 sessions from five mice.

