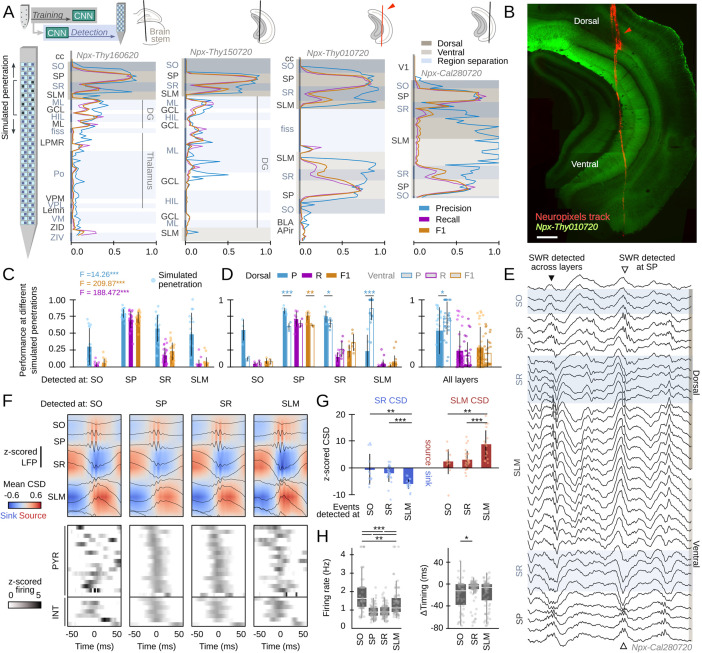
Figure 7. Hippocampus-wide sharp-wave ripple (SWR) dynamics through the lenses of convolutional neural network (CNN).
(A) Neuropixels probes were used to obtain ultra-dense local field potential (LFP) recordings across the entire hippocampus. Offline detection was applied over continuous simulated penetrations (8-channels). Detection performance is evaluated across brain regions and hippocampal layers using the CNN trained with a different electrode type. See Methods for the list of acronyms. (B) Histological validation of one of the experiments shown in A (red arrowhead). Scale bar corresponds to 350 µm. (C) Performance of CNN32 across hippocampal layers (96 dorsal simulated penetrations, four mice). The results of an independent one-way ANOVA for P, R, and F1 is shown separately. ***, p<0.001. (D) Dorsoventral differences of CNN32 performance across layers. P, R, and F1 values from dorsal and ventral detection were compared pairwise (55 dorsal and 55 ventral simulated penetrations, four mice). *, p<0.05; **, p<0.01; ***, p<0.001. (E) Example of an SWR detected across several layers (black arrowhead). Note ripple oscillations all along the SR and SLM. A SWR event which was only detected at SP dorsal and ventral is shown at right (open arrowhead). (F) Mean LFP and current-source density (CSD) signals from the events detected at different layers of the dorsal hippocampus of mouse Npx-Thy160620 (top). Bottom plots show the SWR-triggered average responses of pyramidal cells and interneurons. Cells are sorted by their timing during SWR events detected at SP. (G) Quantification of the magnitude of the SR sink and SLM source for events detected at SO, SR, and SLM, as compared against SP detection. One-way ANOVA SR CSD: F(2)=9.13, p=0.0004; SLM CSD: F(2)=9.64, p=0.0003; **, p<0.01; ***, p<0.001. (H) Quantification of changes of firing rate and timing of pyramidal cells during SWR detected at different layers. Firing rate: F(3) = 28.68, p<0.0001; *, p<0.05; ***, p<0.001. Timing: F(2) = 10.18, p<0.0001; ***, p<0.0001.


