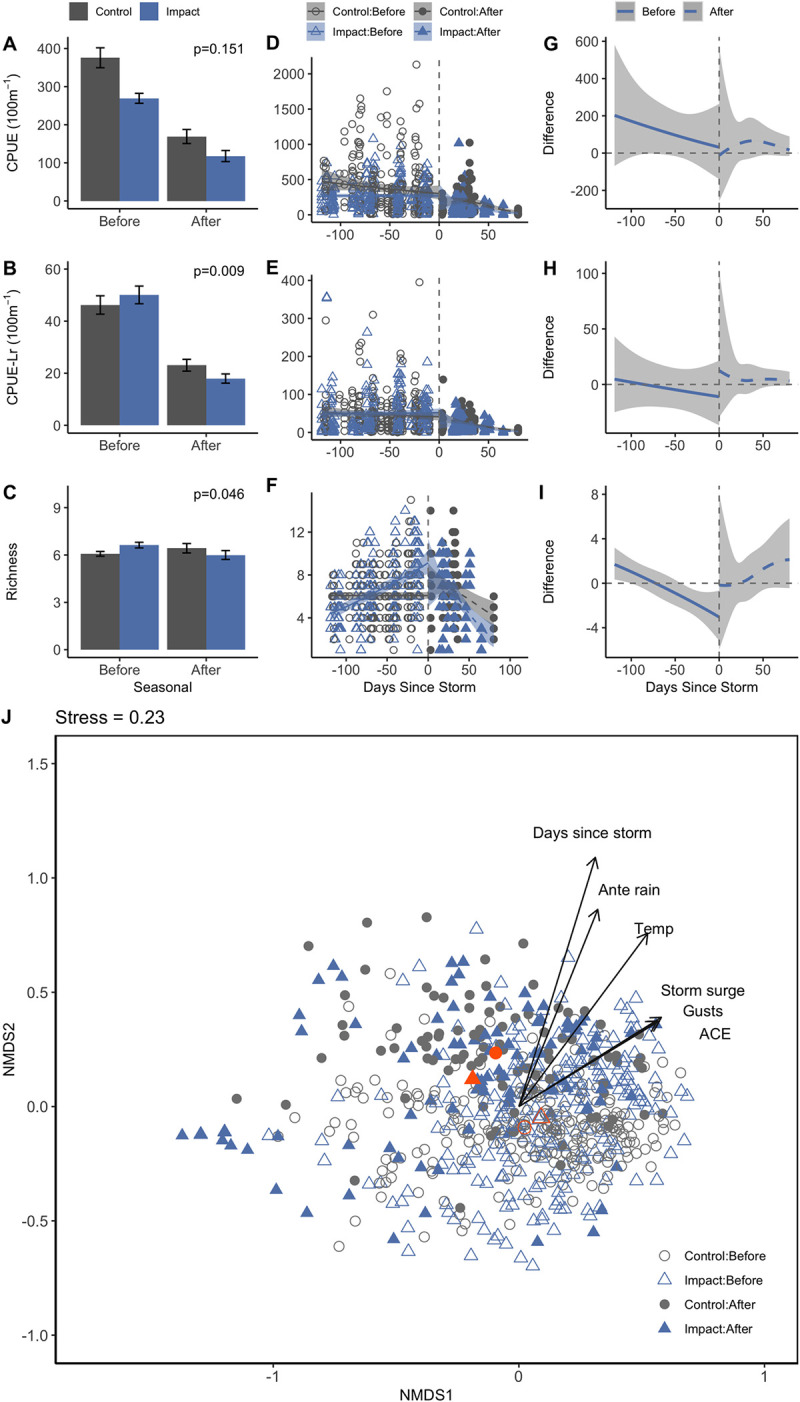
Fig 3. mBACI of seasonal fish catches, species richness, and community structure across time periods and year type.

Means (A-C), trend (D-F), and difference between control and impact trends (G-I) are depicted for seasonal comparisons. Confidence intervals and error bars represent 95% confidence and standard errors, respectively. Smoothed lines represent generalized additive models across the seasonal time frame (y ~ s(Days to Storm), k = 3) for both hurricane and storm-free years based on a cubic regression spline with shrinkage. Non-metric multidimensional scaling of seasonal seagrass-associated fish communities (J) are based on fourth-root Bray-Curtis extended distances of abundance. Gray coloration and circles indicate control years; blue coloration and triangles indicate impact years. Open symbols indicate before periods and filled symbols indicate after periods. Environmental correlates (p<0.1) are plotted as vectors in the direction of ordination influence. Orange symbols indicate group centroids.
