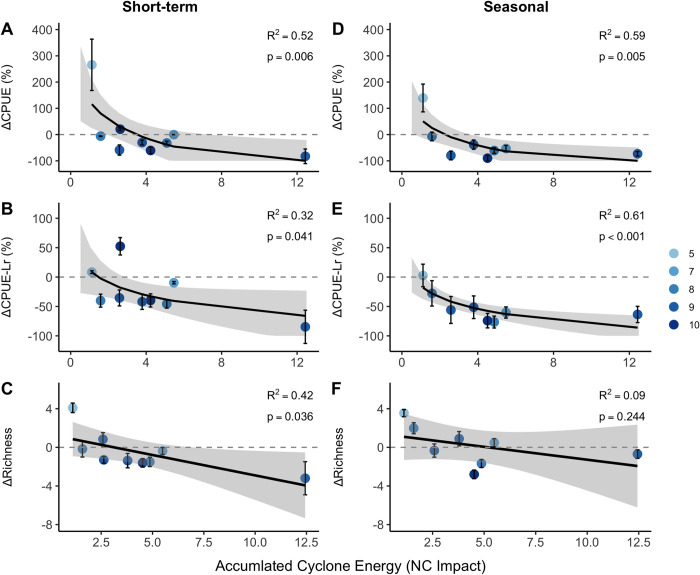
Fig 4. Change in fish metrics as a function of cyclone (tropical storms and hurricanes) intensity.
Short-term changes are depicted column 1, and seasonal-scale changes are represented in column 2. A & D) Proportional change in catch per unit effort. B & E) Proportional change in catch per unit effort sans L. rhomboides, and C & F) change in raw species richness. Models of CPUE and CPUE-Lr represent a tobit regression censored at -100%, and linear regressions are plotted for change in raw species richness. Model shading indicates 95% confidence intervals also censored at -100% for catch metrics. Point coloration (light blue to dark blue) indicates increasing month of impact.

