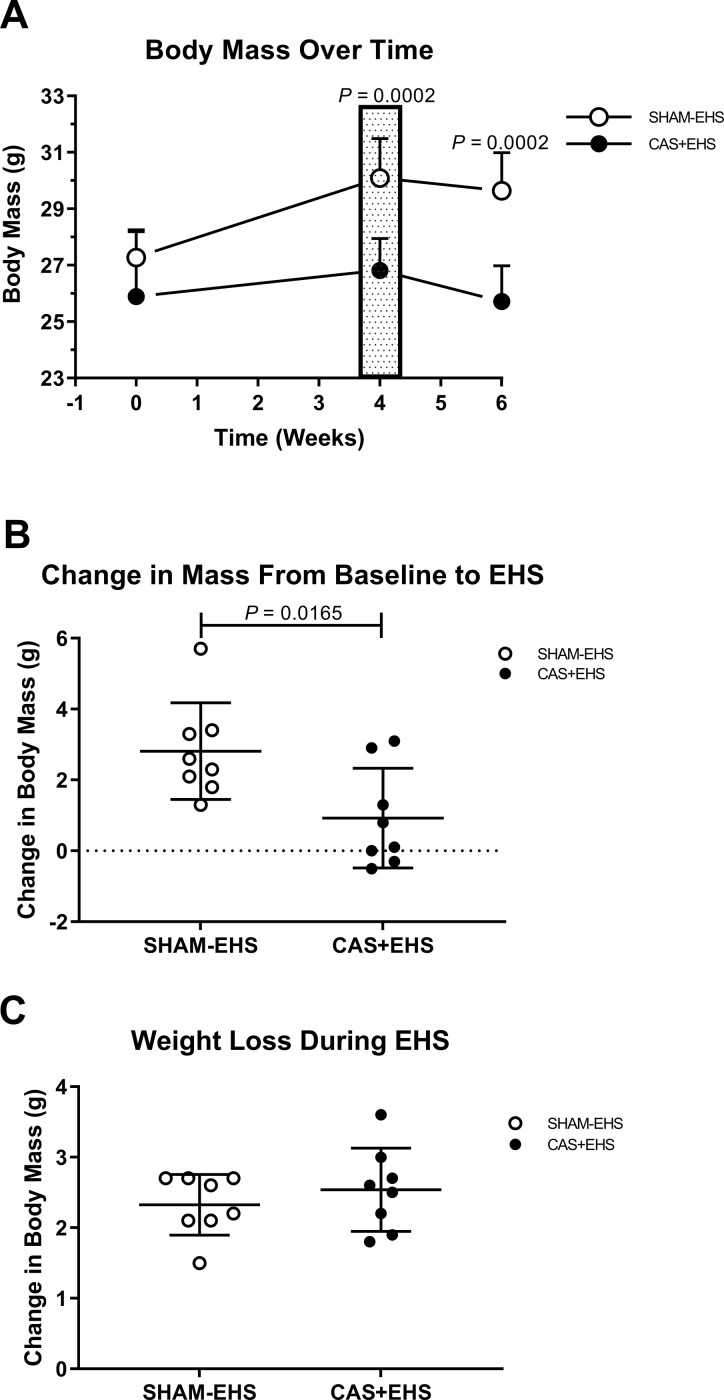
Fig 1.
A) Timeline of changes in body mass throughout experiment. CAS+EHS exhibited lower weights after baseline compared to SHAM-EHS mice. Patterned box at week 4 represents the time within the protocol the mice were exposed to EHS. P values are Bonferroni corrected; Effect sizes: 0.83, 2.74, 3.19, respectively across time. ANOVA followed by orthogonal t-test comparisons between groups at each time point. B) Loss of body mass due to castration from baseline to pre EHS protocol. T- test, Effect size: 1.35. C). Loss of mass during the EHS protocol, not significant, t-test. Effect size: 1.1. All data, all data are means ± SD; n = 8 per group.

