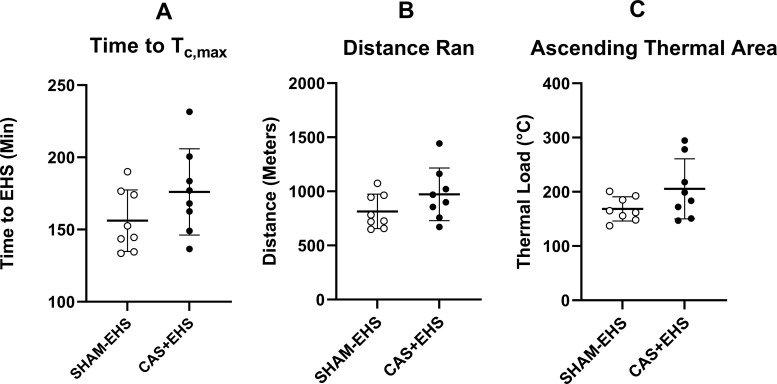
Fig 3.
A) The total time taken for mice to reach the symptom-limited endpoint, Tc,max, of the EHS trial. Effect size: 0.77. B) The total distance run by the end of the EHS trial for CAS+EHS and SHAM-EHS mice. Effect size: 0.76. C) The cumulative ascending thermal area of EHS during the EHS trial (defined by the integration of Tc >39.5°C and time. Effect size: 0.89. All Data: means ± SD; (t-test comparisons), n = 8 per group.

