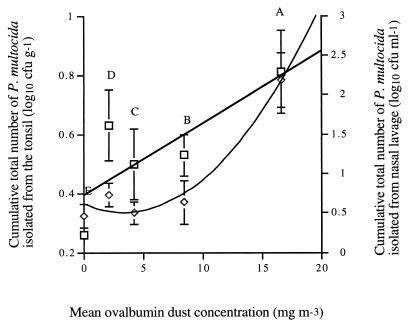
FIG. 2.
Cumulative total number of P. multocida organisms isolated from the tonsil (□; linear regression, y = 0.024x + 0.393 [R2 = 0.645]) and the nasal cavity (◊; quadratic regression, y = 0.010x2 − 0.065x + 0.605 [R2 = 0.963]) over the course of the experiment plotted in relation to the mean ovalbumin dust concentration in the air.

