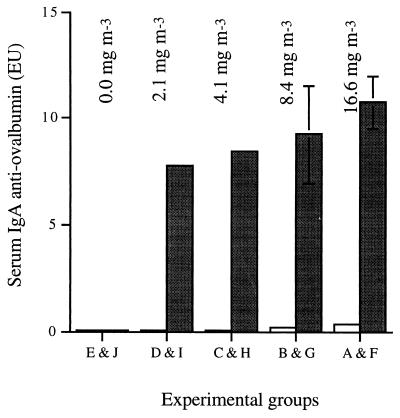
FIG. 4.
Mean IgA responses of pigs to exposure to inhaled ovalbumin dust from 1 to 6 weeks of age, with (open bars, groups A to E) and without (closed bars, groups F to J) challenge with P. multocida. Mean concentrations of ovalbumin in air are shown above the respective exposure groups. Mean IgA responses to ovalbumin exposure were calculated by subtracting the EU value at week 0 from the EU value at week 6. Error bars denote the SD (when not shown, the SD is less than 3).

