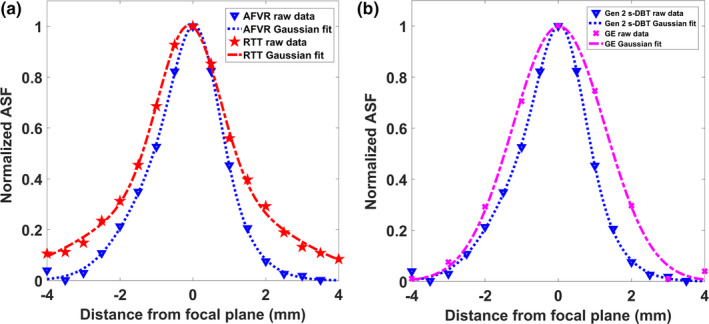
Figure 15.

(a) Plot of the ASF for a 35° angular span for AFVR and RTT reconstruction methods. Both the raw data and the fitted data are shown. The AFVR reconstruction method resulted in a marginal decrease in the ASF. (b) Plot of the ASF for the Gen 2 system utilizing AFVR reconstruction, compared against the measured ASF from the GE system. [Color figure can be viewed at wileyonlinelibrary.com]
