Figure 3.
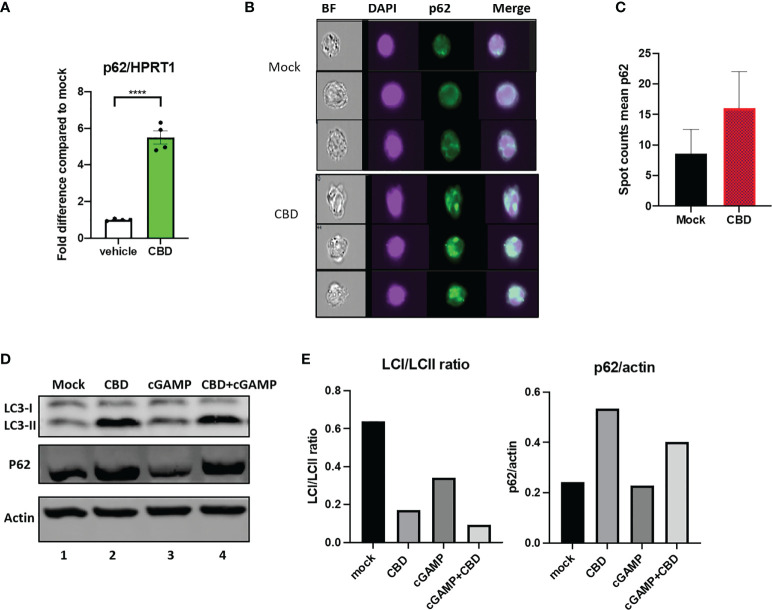
Cannabidiol treatment leads to increased autophagy activity. (A) Real time PCR analysis of p62 expression in THP-1 cells treated with either vehicle or CBD for 8 hours. (B) THP1 cells were treated with CBD overnight, fixed and stained with DAPI, anti-p62 and analyzed by ImageStream. (C) Bar graph showing mean Spot count of p62 for mock and CBD treated THP1 analyzed by ImageStream IDEA software. (D) Western blot of THP1 cells treated with DMSO, CBD, cGAMP or CBD+cGAMP overnight. (E) Bar graph showing LCI/LCII ratio and p62/actin of the western blot analyzed by Image Lab Software. ****p<0.0001.

