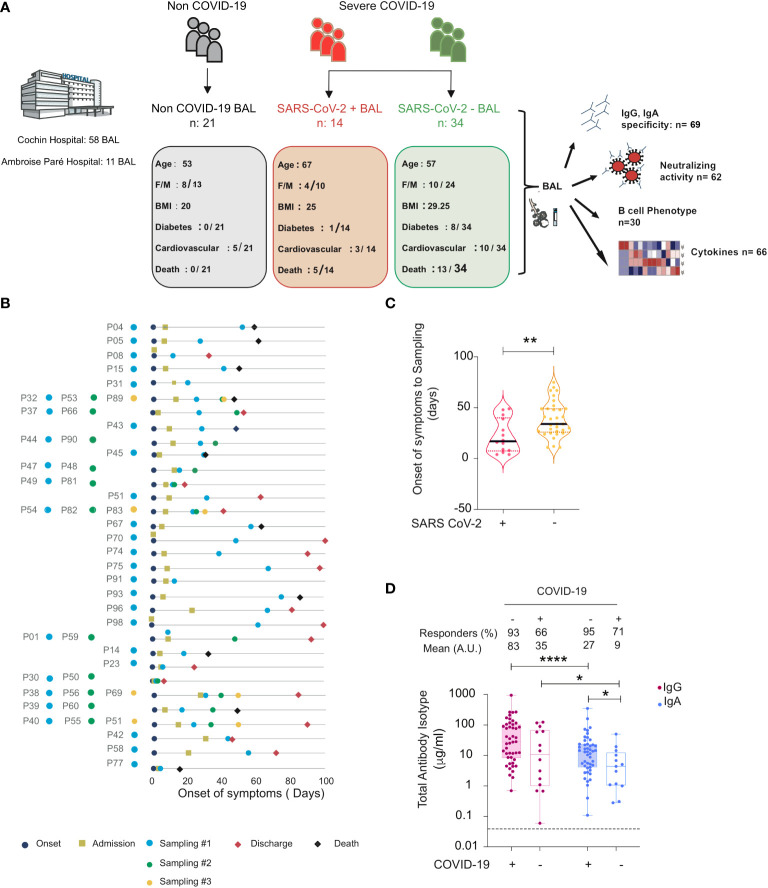
Figure 1.
Total and specific IgG and IgA in BAL from SARS-CoV-2-infected and non-infected individuals. (A) Graphical representation showing the overall study design and the characteristics (number, age, body mass index (BMI), sex (F = female, M = male), diabetes, and fatality rates) of the individuals included in the study. Illustration with images from Servier Medical Art, licensed under the Creative Commons Attribution 3.0 Unported License. (B) Timeline of the course of disease for enrolled patients infected with SARS-CoV-2. (C) SARS-CoV-2 containing (SARS-CoV-2+) samples correspond to the early phase, whereas those lacking virus (SARS-CoV-2−) correspond to a late phase of the disease. Violin plots of time from onset of symptoms to sampling for each sample in SARS-CoV-2+ and SARS-CoV-2− BAL. p-Values were calculated by using Mann–Whitney test. (D) Comparison between values of total IgG and IgA (μg/ml) in BAL from SARS-CoV-2-infected individuals (SARS-CoV-2+ and SARS-CoV-2− BAL) and COVID-19 non-infected individuals. p-Values were calculated by using Wilcoxon test: *, p < 0.05; **, p < 0.01; ****, p < 0.0001. Dashed line: cutoff value for antibody detection. Negative values are not shown. BAL for bronchoalveolar lavage.

