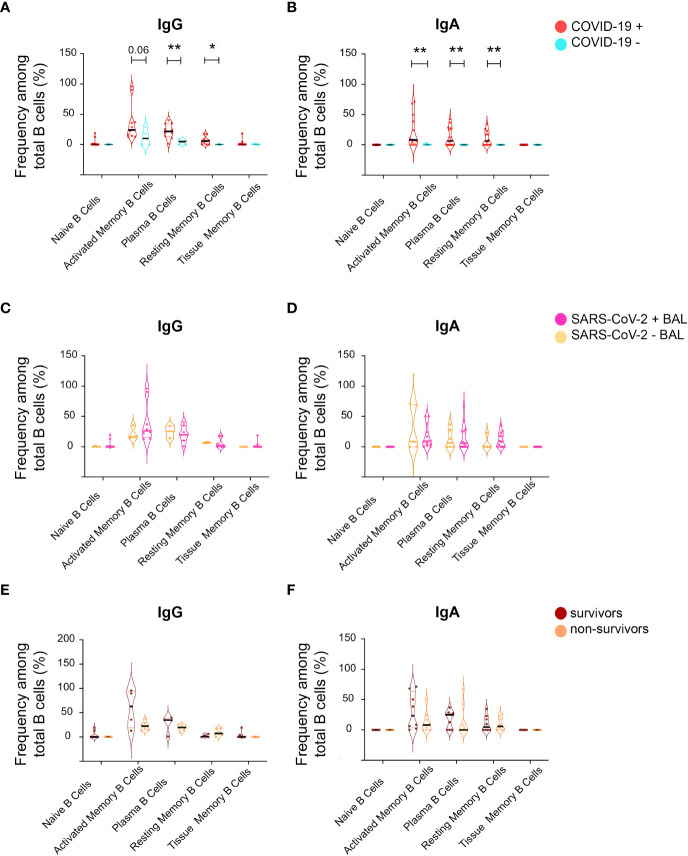
Figure 8.
Analysis of B-cell phenotype in BAL supernatant from SARS-CoV-2-infected individuals. From total B cells, five B-cell populations were defined including Naïve B cells, activated memory B cells, plasma B cells, resting memory B cells, and tissue memory B cells according to a gating strategy shown in Supplementary Figure 1 , which were further labeled for IgG (IgG+) and IgA (IgA+). (A) Frequencies of different IgG+ B-cell populations between COVID-19+ and COVID-19− individuals in the total B-cell population shown as violin plots. (B) Frequencies of different IgA+ B-cell populations between COVID-19+ and COVID-19− individuals in the total IgA+ B-cell population shown as violin plots. (C) Frequencies of different IgG+ B-cell populations between SARS CoV-2+ BAL and SARS CoV-2− BAL individuals in the total IgG+ B-cell population shown as violin plots. (D) Frequencies of different IgA+ B-cell populations between SARS CoV-2+ BAL and SARS CoV-2− BAL individuals in the total IgA+ B-cell population shown as violin plots. (E) Frequencies of different IgG+ B-cell populations between survivors and non-survivors in the total IgG+ B-cell population shown as violin plots. (F) Comparison of different IgA+ B-cell populations between survivors and non-survivors in the total IgA+ B-cell population shown as violin plots. p-Values were calculated by using Mann–Whitney test *, p < 0.05; **, p < 0.01.

