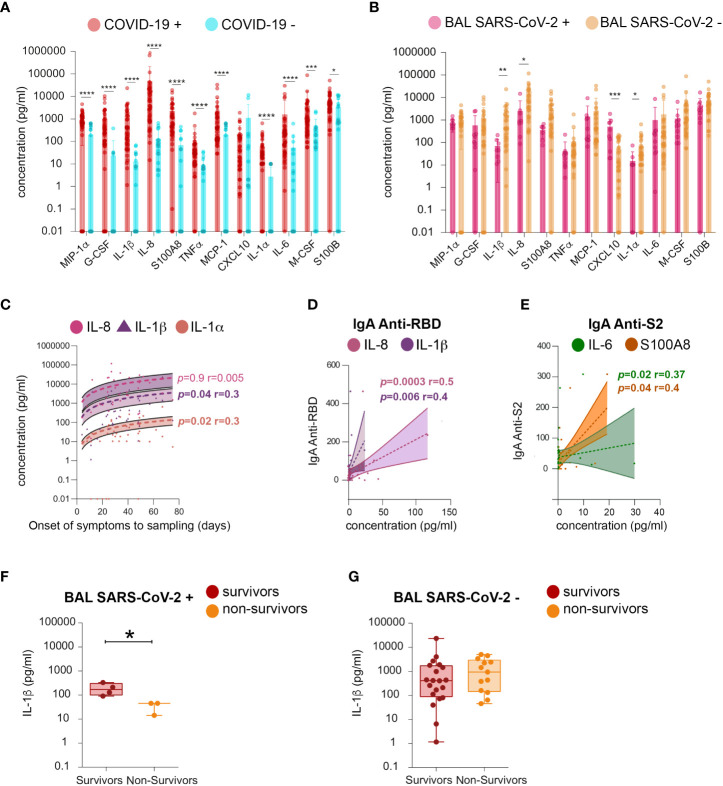
Figure 9.
Analysis of cytokines in BAL fluid. Quantification of the following cytokines in BAL from SARS-CoV-2-infected individuals: MIP-1α, G-CSF, IL-1β (IL-1β), IL-8, S100A8, TNF-a, MCP-1, CXCL10, IL-1α (IL-1A), IL-6, M-CSF, and S100B. (A) Mean amounts of cytokines (pg/ml) evaluated between COVID-19+ and COVID-19− individuals. (B) Mean amounts of cytokines (pg/ml) evaluated between BAL SARS CoV-2+ and BAL SARS CoV-2− individuals. (C) Cross-sectional concentration (pg/ml) of IL-8, IL-1β, and IL-1A as function of time from onset of symptoms to sampling date. (D) Correlation between RBD-specific IgA (shown as proportion of specific IgG or IgA over total IgG or IgA measured by ELISA (specific (OD450)/total IgA or G (μg/ml)) and IL-1β and IL-8 concentration (pg/ml). (E) Correlation between S2-specific IgA (shown as proportion of specific IgG or IgA over total IgG or IgA measured by ELISA (specific (OD450)/total IgA or G (μg/ml)) and S100A8 and IL-6 concentration. (F) Comparison of the levels of IL-1β (pg/ml) between survivors and non-survivors in SARS-CoV-2+ BAL individuals. (G) Comparison of the levels of IL-1β (pg/ml) between survivors and non-survivors in individuals BAL SARS-CoV-2−. p-Values were calculated by using Mann–Whitney test. *, p < 0.05, **, p < 0.01; ***, p < 0.005, ****, p < 0.0001. BAL, bronchoalveolar lavage; G-CSF, granulocyte colony-stimulating factor; RBD, receptor-binding domain.

